The table shows the population, , in thousands, of a small town decreases with time, years.
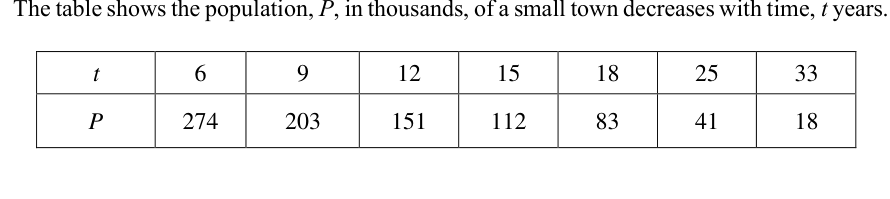
- ((a))
Show your working clearly and draw a straight line graph of against on the grid provided.
- ((b))
Find the gradient of your straight line and hence express in the form of , where and are constants, giving your answers correct to the nearest hundred and to 1 decimal place respectively.
- ((c))
If this model for the population remains valid, find the number of years it will take for the population of the small town to drop below 100000. Give your answer correct to the nearest year.
It won't just hand you the answer — it asks where you're stuck.How the checker works
Worked solution
8((a))
1. Calculate the values of $\ln P$ for each corresponding value of $t$ to 2 decimal places.
For ,
For ,
For ,
For ,
For ,
For ,
For ,
| 6 | 9 | 12 | 15 | 18 | 25 | 33 | |
|---|---|---|---|---|---|---|---|
| 5.61 | 5.31 | 5.02 | 4.72 | 4.42 | 3.71 | 2.89 |
2. Plot the points $(t, \ln P)$ on the given grid and draw a straight line of best fit.
Plot the coordinates , , , , , , and on the grid with on the horizontal axis and on the vertical axis. Draw a straight line passing through these points.
Table of values for :
| 6 | 9 | 12 | 15 | 18 | 25 | 33 | |
|---|---|---|---|---|---|---|---|
| 5.61 | 5.31 | 5.02 | 4.72 | 4.42 | 3.71 | 2.89 |
(A straight line graph is drawn passing through these points on the provided grid.)
8((b))
1. Calculate the gradient of the straight line graph of $\ln P$ against $t$
Using the points and from the table:
Gradient
Gradient (to 1 d.p.)
2. Relate the given non-linear equation to the linear form
Taking natural logarithms on both sides:
This is in the form , where , , gradient , and vertical intercept .
3. Find the value of $k$
Since :
(to 1 d.p.)
4. Find the value of $A$ and state the final equation
Using the point to find the intercept :
(to the nearest hundred)
Therefore, .
Gradient ,
8((c))
1. Set up the inequality or equation using the model from part (b)
From part (b), the model is .
Since is in thousands, a population of corresponds to .
We require :
2. Solve for $t$
3. State the final answer to the nearest year
To the nearest year, .
years
AI analysis — may contain mistakes.
Worked this one out on paper? Snap your steps and Gigle's AI math checker will circle the step where it went wrong.
More questions on this topic
- 1The mass, m mg, of a radioactive substance decreases with time, t hours. Measured values of m and t are given in the tab…
- 2A drug is administered to a patient through an injection. The concentration of drug, mg/ in a patient's bloodstre…
- 3The table shows experimental values of two variables, and . | | 2 | 4 | 6 | 8 | |---|---|---|---|---| | |…
- 4Measured values of and are given in the following table. | | 1.2 | 1.6 | 2.0 | 2.6 | 3.5 | 4.5 | |---|---|--…
- 5The table shows experimental values of and . | | 2 | 3 | 4 | 5 | 6 | |---|---|---|---|---|---| | | 11.8 |…