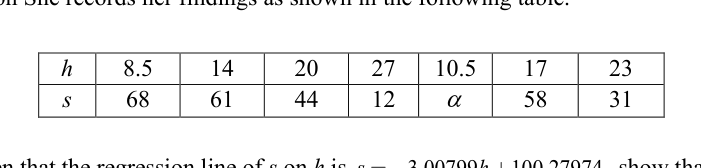
一位教师对7名 student 进行了一项调查,以研究每周“屏幕时间”小时数()与他们在最近结束的考试中获得的平均成绩()之间的关系。她将调查结果记录在下表中。
- (a)
已知 关于 的回归线为 ,证明 。
- (b)
绘制该数据的散点图。
- (c)
通过给出适当的理由,解释为什么与 (a) 部分中的模型相比, 是更好的模型。写出 and 的值。
- (d)
使用这个更好的模型,估计如果一个学生每周花 7 小时的屏幕时间,他预计能获得的成绩。评述所获估计值的可靠性。
- (e)
教师从她的调查结果中观察到一种趋势,并得出结论:增加屏幕时间会导致考试成绩下降。评述这一结论的合理性。
它不会直接告诉你答案,而是问你卡在哪一步看看 AI 是怎么陪你一步步弄懂这道题的
完整解法
9(a)
1. Calculate the sample mean of $h$ and write an expression for the sample mean of $s$.
2. Substitute $(\bar{h}, \bar{s})$ into the regression equation to solve for $\alpha$.
The least squares regression line always passes through the mean point .
9(b)
1. Set up axes and plot the data points including the value found in part (a)
Using from part (a), draw a horizontal axis for (screen-time in hours) and a vertical axis for (exam score). Use appropriate scales to accommodate and .
Plot the following 7 coordinates :
A scatter diagram with on the horizontal axis and on the vertical axis, with the 7 given data points correctly plotted.
9(c)
1. Calculate the product moment correlation coefficient ($r$) for both the linear model and the quadratic model using a graphing calculator.
Let be the PMCC for and , and be the PMCC for and .
Using a graphing calculator with the data (and ):
2. Provide appropriate reasons explaining why the quadratic model is better.
- Comparing the values, (i.e. ). Since the PMCC for and is closer to , it indicates a stronger linear correlation between and than between and .
- The scatter diagram from part (b) shows that the data points follow a curve with an increasing rate of decrease, rather than a straight line. This curvilinear trend is better modelled by .
3. State the values of $k$ and $c$ by performing linear regression of $s$ on $h^2$.
Using a graphing calculator, the equation of the linear regression line of on is:
Thus, correcting to 3 significant figures:
Reasons:
- The product moment correlation coefficient () between and is approximately , whereas the between and is . Since is closer to , the linear correlation for the quadratic model is stronger.
- The scatter diagram drawn in part (b) shows the data points following a distinct curve, which is better modelled by the non-linear relationship .
Values:
(to 3 s.f.)
(to 3 s.f.)
9(d)
1. Establish the equation of the 'better model' from part (c) and substitute $h = 7$ to estimate the score.
By performing a linear regression of on (as required in part c), we obtain and .
The better model is .
Substituting :
2. Comment on the reliability of the estimate.
The value lies outside the given data range of (). As this prediction involves extrapolation, the estimate is unreliable.
; The estimate is unreliable as involves extrapolation.
9(e)
1. Evaluate the validity of the statement by distinguishing between correlation and causation.
The statement is not valid. While the data shows a negative correlation between screen-time and exam scores, correlation does not imply causation. There could be other underlying factors affecting the exam scores.
The statement is not valid. Correlation does not imply causation.
AI 分析,可能出错
用 AI 批改,圈出写错的那一步,并自动将你的薄弱点存入错题本,形成你的错因库。
同一知识点的其他题
- 1一位教师对7名学生进行了调查,以研究每周“屏幕时间”小时数()与他们在最近结束的考试中获得的平均分数()之间的关系。她将自己的调查结果记录在下表中。 已知 对 的回归线为 …
- 2下表给出了某员工在公司工作的年数()以及该员工获得的相应薪资增幅(以美元计,)。 | 年数, | 6 | 7 | 9 | 11 | 13 | 15 | 18 | |---|---|---|---|---|---|---|…
- 3据信,随机选择的孕妇生育唐氏综合征患儿的概率 与孕妇的年龄 (以岁为单位)相关。下表给出了 5 个不同的 值所对应的 的观测值。 | | 25 | 30 | 35 | 40 | 45 | |---|--…
- 4在一项实验中,记录了 1 kg 冰块在 7 种预设温度 下完全融化所需的时间 分钟,如下表所示。 艾伯特(Albert)分析了这些数据并得出以下结论: 积矩相关系数,…
- 5一家电器供应商正在调查在流行社交媒体平台 SnapGram 上的月度广告支出(记为 ,单位为千美元)对其月销售利润(记为 ,单位为千美元)的潜在影响。该供应商收集了过去一年中的以下数据。 这组数据被认为可以用以下方程之一进行建模…