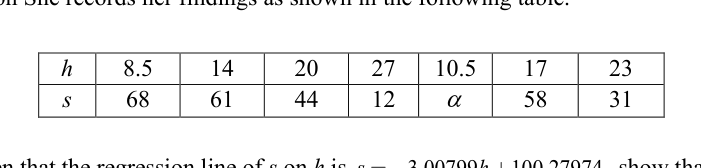
A teacher conducts a survey on 7 students to investigate the relationship between the number of hours () of "screen-time" per week and the average scores () they obtained in a recently concluded examination. She records her findings as shown in the following table.
- (a)
Given that the regression line of on is , show that .
- (b)
Draw a scatter diagram for the data.
- (c)
Explain why is the better model compared to the one in part (a), by giving appropriate reasons. State the values of and .
- (d)
Using the better model, estimate the score a student can expect to obtain if he spends 7 hours of screen-time a week. Comment on the reliability of the estimate obtained.
- (e)
The teacher observes a trend from her findings and concludes with a statement: Increased screen-time will cause the exam scores to decrease. Comment on the validity of the statement.
It won't just hand you the answer — it asks where you're stuck.How the checker works
Worked solution
9(a)
1. Calculate the sample mean of $h$ and write an expression for the sample mean of $s$.
2. Substitute $(\bar{h}, \bar{s})$ into the regression equation to solve for $\alpha$.
The least squares regression line always passes through the mean point .
9(b)
1. Set up axes and plot the data points including the value found in part (a)
Using from part (a), draw a horizontal axis for (screen-time in hours) and a vertical axis for (exam score). Use appropriate scales to accommodate and .
Plot the following 7 coordinates :
A scatter diagram with on the horizontal axis and on the vertical axis, with the 7 given data points correctly plotted.
9(c)
1. Calculate the product moment correlation coefficient ($r$) for both the linear model and the quadratic model using a graphing calculator.
Let be the PMCC for and , and be the PMCC for and .
Using a graphing calculator with the data (and ):
2. Provide appropriate reasons explaining why the quadratic model is better.
- Comparing the values, (i.e. ). Since the PMCC for and is closer to , it indicates a stronger linear correlation between and than between and .
- The scatter diagram from part (b) shows that the data points follow a curve with an increasing rate of decrease, rather than a straight line. This curvilinear trend is better modelled by .
3. State the values of $k$ and $c$ by performing linear regression of $s$ on $h^2$.
Using a graphing calculator, the equation of the linear regression line of on is:
Thus, correcting to 3 significant figures:
Reasons:
- The product moment correlation coefficient () between and is approximately , whereas the between and is . Since is closer to , the linear correlation for the quadratic model is stronger.
- The scatter diagram drawn in part (b) shows the data points following a distinct curve, which is better modelled by the non-linear relationship .
Values:
(to 3 s.f.)
(to 3 s.f.)
9(d)
1. Establish the equation of the 'better model' from part (c) and substitute $h = 7$ to estimate the score.
By performing a linear regression of on (as required in part c), we obtain and .
The better model is .
Substituting :
2. Comment on the reliability of the estimate.
The value lies outside the given data range of (). As this prediction involves extrapolation, the estimate is unreliable.
; The estimate is unreliable as involves extrapolation.
9(e)
1. Evaluate the validity of the statement by distinguishing between correlation and causation.
The statement is not valid. While the data shows a negative correlation between screen-time and exam scores, correlation does not imply causation. There could be other underlying factors affecting the exam scores.
The statement is not valid. Correlation does not imply causation.
AI analysis — may contain mistakes.
Worked this one out on paper? Snap your steps and Gigle's AI math checker will circle the step where it went wrong.
More questions on this topic
- 1A teacher conducts a survey on 7 students to investigate the relationship between the number of hours () of "screen-t…
- 2The number of years () an employee has worked for the company and the corresponding salary increment, in dollars (…
- 3It is believed that the probability of a randomly chosen pregnant woman giving birth to a Down's Syndrome child is r…
- 4In an experiment, the time taken, minutes, for a 1-kg block of ice to melt completely under 7 pre-determined tempera…
- 5An electrical appliance supplier is investigating the potential impact of monthly advertisement expenditure, denoted as…