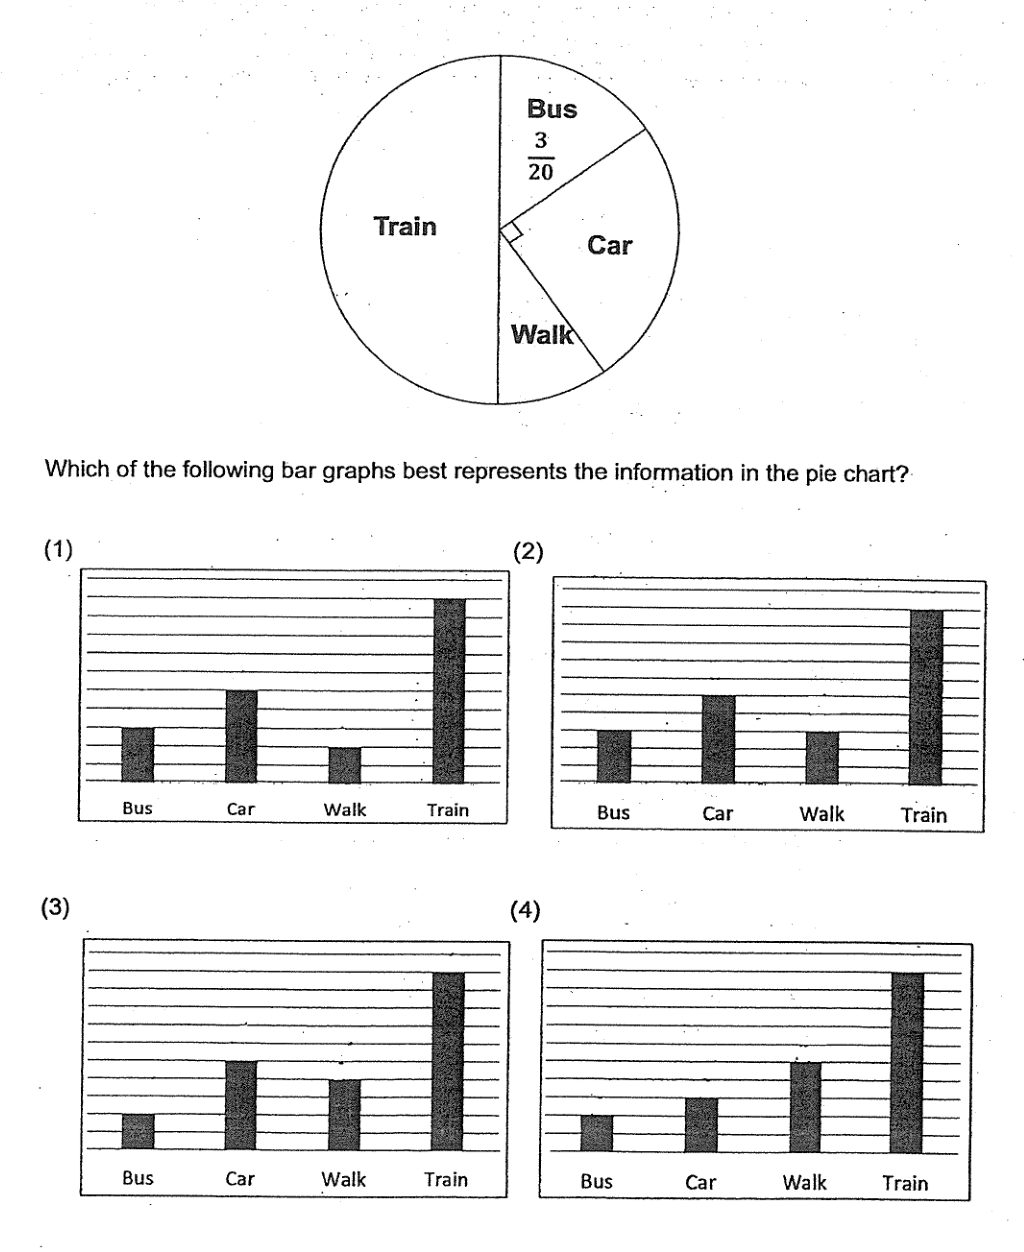
The pie chart shows the mode of transport taken by Primary Six students to school. of the students take the train to school. Which of the following bar graphs best represents the information in the pie chart?
Relating integer division and fractionsFour operations on decimals and fractionsRatio and proportion中文
It won't just hand you the answer — it asks where you're stuck.How the checker works
Worked solution
No solution to show yet.
Worked this one out on paper? Snap your steps and Gigle's AI math checker will circle the step where it went wrong.
More questions on this topic
- 1The figure below is made up of 2 squares, ABCD and DEFG. X is a point on GD and Y is a point on DE. BC = 7 cm, FE = 6 cm…
- 2In a camp, the number of children is of the number of adults. of the children are boys and t…
- 3小明骑自行车从家到学校,他骑车的速度和所需时间成___比例;分数值一定,分子与分母成___比例.
- 4要想富先修路。某村为了把农产品运出销售,要修一条公路。甲队单独修要15天完成,乙队单独修要10天完成。如果甲、乙两队合修,( )天可以修完这条公路的。 A. 2 B. 3 C. 6 D. 12
- 5Munirah cycled from her home to a park. On her way, she had to cycle past a library. What was the distance she cycled fr…