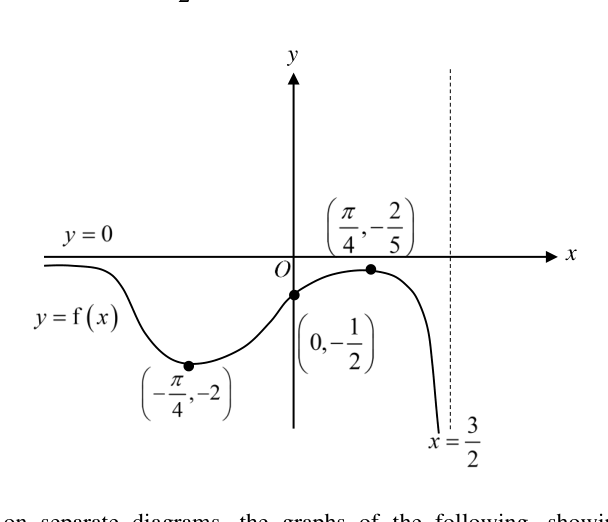
The diagram below shows the graph of for . The graph has stationary points at and , axial intercept at and asymptotes and . Sketch, on separate diagrams, the graphs of the following, showing clearly the coordinates of stationary points, axial intercepts and equations of asymptotes where applicable.
- ((i))
.
- ((ii))
.
It won't just hand you the answer — it asks where you're stuck.How the checker works
Worked solution
1((i))
1. Determine the coordinates and nature of the stationary points for $y = \frac{1}{f(x)}$.
The stationary points of occur at the same -values as .
At , . Thus, . Since has a local minimum of a negative value, its reciprocal will have a local maximum. Hence, there is a local maximum at .
At , . Thus, . Since has a local maximum of a negative value, its reciprocal will have a local minimum. Hence, there is a local minimum at .
2. Determine the new $y$-intercept.
The -intercept of is .
Taking the reciprocal, the -intercept of is .
3. Determine the end behaviours of the graph at the boundaries of its domain.
As , , so .
As , , so .
This means the graph terminates at an open (hollow) circle at instead of having a vertical asymptote.
4. Describe the final sketch incorporating all features.
Draw a smooth continuous curve for that comes from in the third quadrant, rises to a local maximum at , falls through the -intercept at down to a local minimum at , and then rises to terminate at an open circle at . There are no asymptotes to draw.
A smooth sketch of in the domain containing:
- A local maximum at
- A -intercept at
- A local minimum at
- An open circle terminating the curve at
- A left tail tending downwards to as (with no asymptotes).
1((ii))
1. Determine the x-intercepts of the derived function.
The stationary points of occur at and . At these points, the gradient is zero.
Thus, the -intercepts of are and .
2. Determine the intervals where the derivative is positive or negative.
By observing the gradient of :
- For , is decreasing, so the gradient is negative ().
- For , is increasing, so the gradient is positive ().
- For , is decreasing, so the gradient is negative ().
3. Determine the asymptotes of the derived function.
As , approaches the horizontal asymptote flattening out, meaning its gradient approaches 0. Thus, is a horizontal asymptote for .
As , the curve of and gets increasingly steep downwards, meaning the gradient . Thus, is a vertical asymptote.
A sketched curve of with the following features:
- -intercepts at and .
- Horizontal asymptote as .
- Vertical asymptote as .
- Curve is below the -axis for , with a local minimum.
- Curve is above the -axis for , passing through the positive -axis with a local maximum.
- Curve is below the -axis for .
AI analysis — may contain mistakes.
Worked this one out on paper? Snap your steps and Gigle's AI math checker will circle the step where it went wrong.
More questions on this topic
- 15 (a) Solve the following integral. …
- 2Sketch, on the same diagram, the graphs of and . (You are not required to label any a…
- 3The diagram shows the graphs of and . The graph of has t…
- 4The graph of has a maximum turning point at and passes through the origin. The lines …
- 5On a single diagram, sketch the graphs of and where the following conditions are satisfied, indi…