The graph of has a maximum turning point at and passes through the origin. The lines and are asymptotes to the graph, as shown in the diagram below.
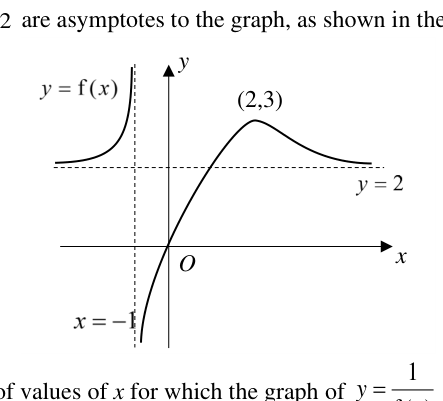
- (a)
State the range of values of for which the graph of is increasing.
- (b)
Sketch the graph of , showing clearly the axial intercepts and the asymptotes.
It won't just hand you the answer — it asks where you're stuck.How the checker works
Worked solution
3(a)
1. Relate the increasing behaviour of $\frac{1}{\mathrm{f}(x)}$ to that of $\mathrm{f}(x)$
Differentiating, .
Since , the reciprocal graph is increasing precisely where , i.e. where is decreasing.
2. Identify where $\mathrm{f}$ is decreasing from the given graph
From the diagram:
- For , the curve decreases as increases (and stays above , so ).
- For , the curve increases up to the maximum at .
- For , the curve decreases towards (staying above , so ).
Thus is decreasing for and for .
3. State the required range
Therefore is increasing for
or
3(b)
1. Determine the sign of f'(x) on each interval from the shape of f
From the graph of :
- For , is decreasing .
- For , is increasing (from up to the maximum) .
- At the maximum turning point , .
- For , is decreasing (towards ) .
2. Find the intercepts and asymptotes of y = f'(x)
-intercept: , so the graph cuts the -axis at .
-intercept: at the origin is increasing, so — a positive -intercept.
Asymptotes: has a vertical asymptote at , so also has the vertical asymptote . Since (a constant) as , the gradient , giving the horizontal asymptote .
3. Translate limiting slopes into the two branches and sketch
Limiting gradients:
- : flattens onto from above while decreasing .
- : steeply (decreasing) .
- : but rising steeply .
- : approaches from above (decreasing) .
Left branch (): lies below the -axis, rising from near to as .
Right branch (): falls from near , through a positive -intercept, crossing , then below the axis approaching as .
Two branches with vertical asymptote and horizontal asymptote .
- For : throughout; as , , and as , .
- For : as , ; the curve decreases, has a positive -intercept at , crosses the -axis at (the maximum point of ), becomes negative and approaches as .
Axial intercepts shown: -intercept and a positive -intercept. Asymptotes: and .
AI analysis — may contain mistakes.
Worked this one out on paper? Snap your steps and Gigle's AI math checker will circle the step where it went wrong.
More questions on this topic
- 15 (a) Solve the following integral. …
- 2Sketch, on the same diagram, the graphs of and . (You are not required to label any a…
- 3The diagram shows the graphs of and . The graph of has t…
- 4On a single diagram, sketch the graphs of and where the following conditions are satisfied, indi…
- 5Find the exact roots of the equation …