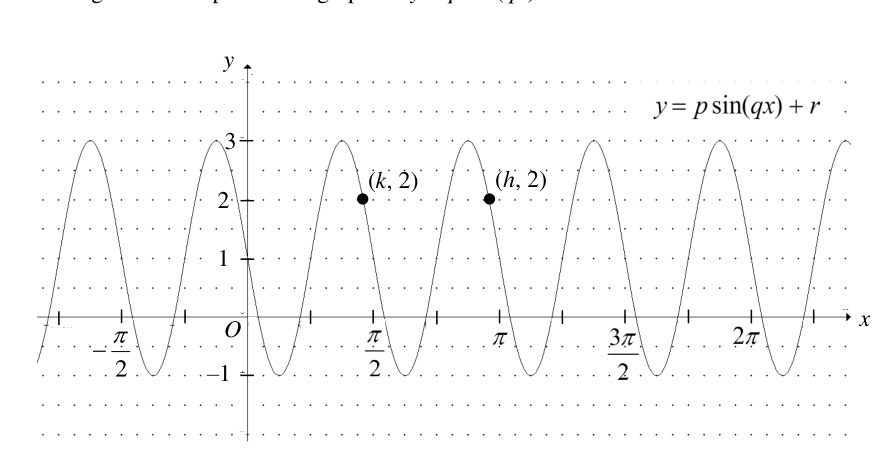
The diagram shows part of the graph of .
- (i)
Find the value of each of the constants , and .
- (ii)
Given that and lie on the curve as shown, find an equation connecting , and .
It won't just hand you the answer — it asks where you're stuck.How the checker works
Worked solution
1(i)
1. Find the vertical shift $r$ using the maximum and minimum values
The maximum value is and the minimum value is .
2. Find the amplitude $p$ using the maximum and minimum values
3. Find the frequency multiplier $q$ using the period of the graph
From the graph, one full cycle is completed between and , so the period is .
, ,
1(ii)
1. Identify the $x$-coordinate of the maximum point between $k$ and $h$
From part (i), the curve is . The first maximum occurs when , which gives .
2. Use the symmetry of the sine curve to relate $k$, $h$, and the maximum point
The points and have the same -value and lie on either side of the first maximum. Due to the symmetry of the sine curve, the -coordinate of the maximum is the midpoint of and .
AI analysis — may contain mistakes.
Worked this one out on paper? Snap your steps and Gigle's AI math checker will circle the step where it went wrong.
More questions on this topic
- 1State the range of principal values of . The curve is shown below for …
- 2The diagram below shows a portion a plastic fibre cable, which allows light waves to pass through. The path of the light…
- 3The diagram shows a wind turbine with blade in length. The centre of the wind turbine is fro…
- 4The diagram shows the curve for radians. A minimum point …
- 5A clock is set on the vertical wall on the roof of a building. The distance from the centre of the clock, , to the ti…