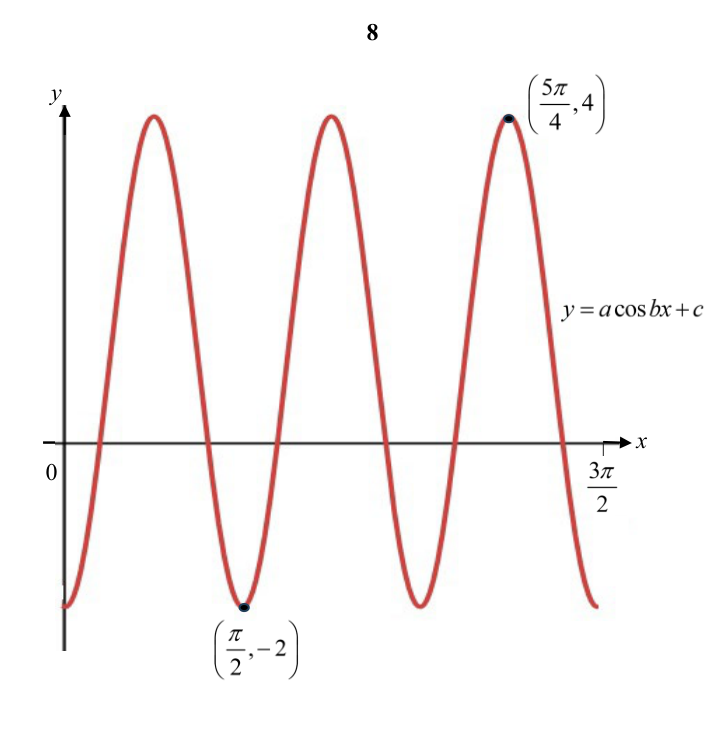
The diagram shows the curve for radians. A minimum point and a maximum point are indicated on the diagram.
- (a)
Explain why .
- (b)
Explain why .
- (c)
Hence find the equation of the curve.
It won't just hand you the answer — it asks where you're stuck.How the checker works
Worked solution
7(a)
1. Find the horizontal distance between the given minimum and maximum points.
Horizontal distance
2. Relate the distance to the period of the function to find $b$.
From the graph, this distance spans cycles (from a minimum to the second maximum after it).
Since , we have .
The distance between the minimum and maximum points is , which corresponds to periods. Thus, the period is , giving .
7(b)
1. Relate the constant $c$ to the maximum and minimum values of the curve
The constant represents the vertical shift (principal axis) of the curve, which is the average of the maximum and minimum -values.
2. Substitute the given maximum and minimum values to show $c = 1$
The value of is the average of the maximum and minimum values of the curve, hence .
7(c)
1. Substitute the known values of $b$, $c$, and a point on the curve to find $a$.
Using and from parts (a) and (b), the equation is .
Substitute the minimum point into the equation:
2. State the final equation of the curve.
The equation of the curve is .
AI analysis — may contain mistakes.
Worked this one out on paper? Snap your steps and Gigle's AI math checker will circle the step where it went wrong.
More questions on this topic
- 1函数,则函数的最大值为 A. B. C. D.
- 2Using , where and , solve the equation …
- 3State the range of principal values of . The curve is shown below for …
- 4The diagram below shows a portion a plastic fibre cable, which allows light waves to pass through. The path of the light…
- 5The diagram shows a wind turbine with blade in length. The centre of the wind turbine is fro…