The diagrams below show the graphs of and . On separate diagrams, sketch the graphs of: showing clearly, in each case, the intersection(s) with the axes, the coordinates of the turning point(s) and the equation(s) of the asymptotes.
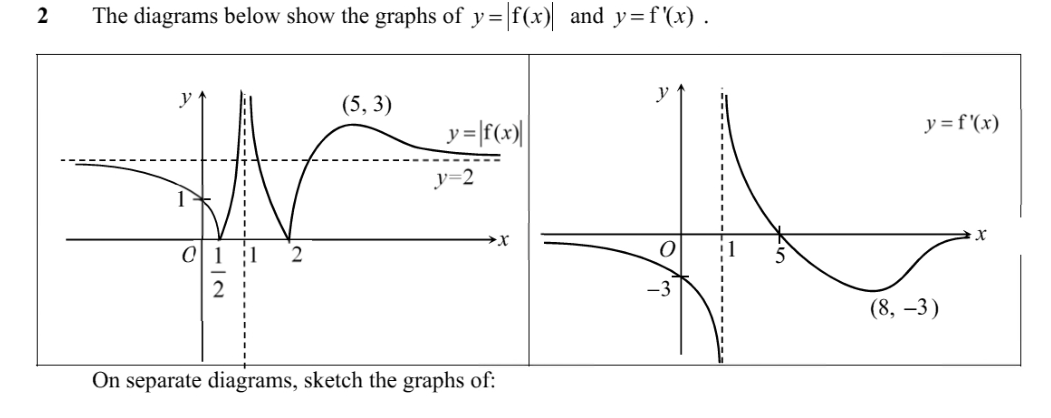
- (i)
- (ii)
- (iii)
It won't just hand you the answer — it asks where you're stuck.How the checker works
Worked solution
2(i)
1. Identify the geometrical transformations applied to the original graph $y = |\mathrm{f}(x)|$.
To obtain the graph of from , we apply the following sequence of transformations:
- A horizontal scaling parallel to the -axis by a scale factor of .
- A vertical translation of unit in the positive -direction.
In terms of coordinates, any point on the original graph is mapped to .
2. Determine the new equations for the asymptotes.
Apply the transformations to the original asymptotes:
- Horizontal asymptote: is scaled horizontally (which has no effect) and then translated upwards by . The new horizontal asymptote is .
- Vertical asymptote: is scaled horizontally by a factor of and translated vertically (which has no effect). The new vertical asymptote is .
3. Calculate the transformed coordinates of the intersections and turning points.
Apply the mapping to the key points of :
- -intercept: .
- First minimum: .
- Second minimum: .
- Local maximum: .
Since the minimum -value of the new graph is , the graph lies entirely above the -axis, meaning there are no -intercepts.
The sketch of should include:
- Asymptotes: and
- -intercept:
- -intercepts: None
- Turning points: Minima at and , and a local maximum at
2(ii)
1. Find the intersection points with the coordinate axes.
To find the -intercept, substitute :
So, the -intercept is .
To find the -intercept, set :
From the given graph of , this occurs at the vertical asymptote . Thus, the curve intersects the -axis at .
2. Identify the asymptotes.
Vertical asymptotes occur where the denominator is zero, i.e., . From the given graph, the -intercept is at . Hence, there is a vertical asymptote at .
As , the graph shows . As the denominator approaches , the value of . Thus, there are no horizontal asymptotes.
3. Find the coordinates and nature of the turning points.
Turning points of correspond to turning points of .
The given graph has a local minimum at .
The corresponding point on the reciprocal graph is .
Since is negative and has a local minimum at this point, taking its reciprocal produces a local maximum. Thus, there is a local maximum at .
4. Deduce the shape of the graph and sketch.
Synthesising the features for the sketch:
- For : is negative and approaches from . Thus increases from to , crossing the -axis at .
- For : is positive, decreasing from to . Thus is positive, increasing from up towards at .
- For : is negative, goes down to and back up to . Thus is negative, comes up from at , reaches a local maximum at , and curves back down towards as .
A sketch of featuring:
- -intercept at and -intercept at .
- Vertical asymptote at .
- Local maximum turning point at .
- No horizontal asymptotes.
2(iii)
1. Determine the shape and sign of $f(x)$ for $x < 1$.
From the graph of , we observe that for . Thus, is strictly decreasing on .
The graph of touches the -axis at , which implies .
Since is strictly decreasing, we deduce that for and for .
Therefore, for , and for . The curve reflects below the -axis for , approaching as .
2. Determine the shape and sign of $f(x)$ for $x > 1$.
From the graph of , for and for . Thus, is strictly increasing on and strictly decreasing on .
The graph of touches the -axis at , implying .
Since is increasing on , we deduce that for and for .
Therefore, for (approaching as ), and for .
At , reaches a local maximum.
3. Identify all key features to be labeled on the sketch.
To sketch , draw the curve identical to for and , and reflect the sections and across the -axis.
The required features to be clearly labeled on the sketch are:
- -intercept:
- -intercepts: and (the curve smoothly crosses the -axis at both points without sharp turns)
- Turning point: Local maximum at
- Asymptotes: (vertical) and (horizontal)
Sketch of :
- A continuous branch for approaching the horizontal asymptote as , crossing the -axis at , crossing the -axis at , and approaching the vertical asymptote downwards ().
- A continuous branch for emerging from the vertical asymptote upwards from , crossing the -axis at smoothly, reaching a local maximum at , and decreasing towards the horizontal asymptote as .
Key features to label:
- Intersections with axes: , , and
- Turning point: Local maximum at
- Asymptotes: and
AI analysis — may contain mistakes.
Worked this one out on paper? Snap your steps and Gigle's AI math checker will circle the step where it went wrong.
More questions on this topic
- 1将函数的图象保持纵坐标不变,先将横坐标缩短为原来的,再向右平移个单位长度后得到,则的解析式为…
- 2By expressing the equation of the curve in the form , where …
- 3A curve has the equation where . Sketch , stating the coordinates of any points o…
- 4The diagram shows the graphs of and . The graph of has t…
- 5The curve with equation is transformed to curve by a translation of …