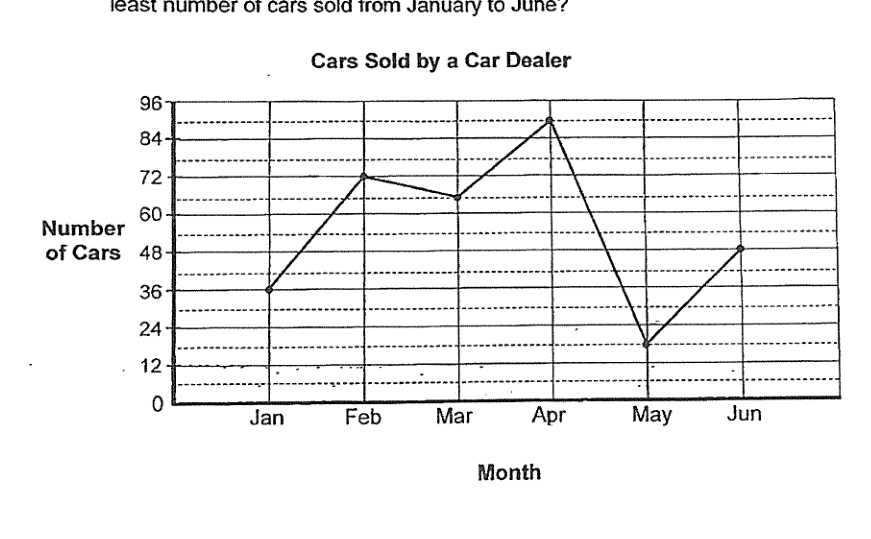
The line graph below shows the number of cars sold monthly from January to June by a car dealer. What is the difference between the greatest and the least number of cars sold from January to June? Ans: ___
It won't just hand you the answer — it asks where you're stuck.How the checker works
Worked solution
20
1. Identify the greatest and least number of cars sold from the graph
From the graph, the greatest number of cars sold is in April ().
The least number of cars sold is in May ().
2. Calculate the difference between the greatest and least number of cars sold
Answer
AI analysis — may contain mistakes.
Worked this one out on paper? Snap your steps and Gigle's AI math checker will circle the step where it went wrong.
More questions on this topic
- 1The figure below is made up of 2 squares, ABCD and DEFG. X is a point on GD and Y is a point on DE. BC = 7 cm, FE = 6 cm…
- 2Find the value of . Ans: ___
- 3In a camp, the number of children is of the number of adults. of the children are boys and t…
- 4A can of mushroom soup costs $3.20 and a bundle of 3 cans of mushroom soup costs $8. Diane wants to buy 20 cans of mus…
- 5A group of singers are arranged in 5 rows. There are 7 singers in the second row. Each row has more singers than the…