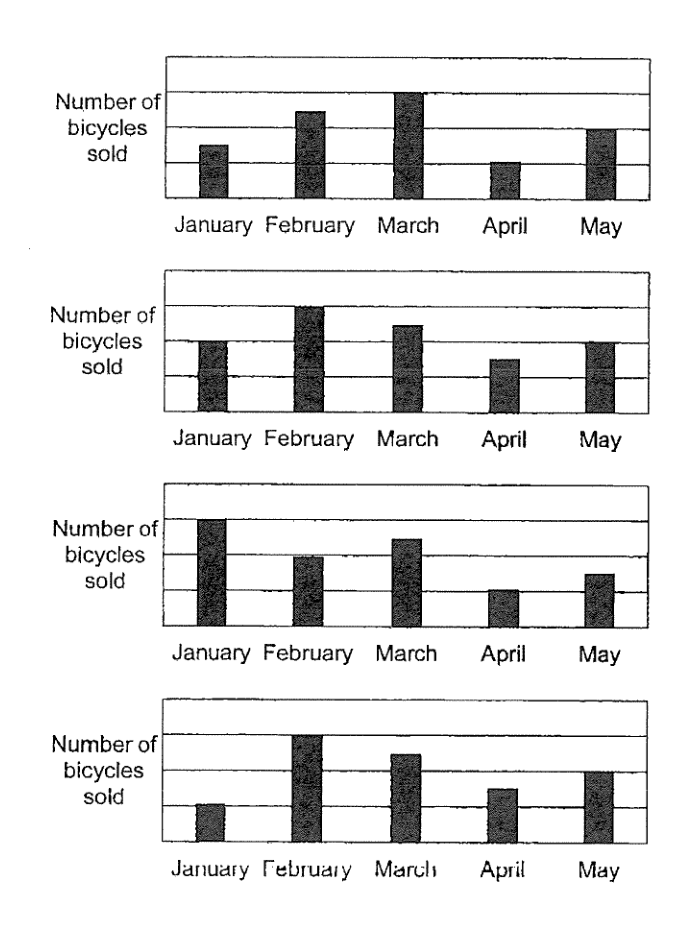
The table below shows the number of bicycles sold each month by a shop.
Month Number of bicycles sold January 53 February 150 March 124 April 76 May 99
Which of the following bar graphs best represents the information shown in the table?
| Month | Number of bicycles sold |
|---|---|
| January | 53 |
| February | 150 |
| March | 124 |
| April | 76 |
| May | 99 |
It won't just hand you the answer — it asks where you're stuck.How the checker works
Worked solution
13
1. Identify the highest and lowest values in the table to eliminate incorrect graphs.
From the table, the lowest number of bicycles sold is in January () and the highest is in February ().
- Graph (1) shows March as the highest. (Incorrect)
- Graph (3) shows January as the highest. (Incorrect)
2. Compare the remaining graphs using relative proportions.
Comparing Graph (2) and Graph (4):
In Graph (2), the bar for January is taller than the bar for April. However, , so January's bar must be shorter than April's bar. Thus, Graph (2) is incorrect.
In Graph (4), the heights are approximately proportional to the sales if grid unit represents bicycles:
- January: unit
- February: units
- March: units
- April: units
- May: units
Graph (4) correctly represents the data.
Graph (4) (option 4)
AI analysis — may contain mistakes.
Worked this one out on paper? Snap your steps and Gigle's AI math checker will circle the step where it went wrong.
More questions on this topic
- 1数学考试甲、乙两名同学的平均分是88分,甲、丙两名同学的平均分是90,乙、丙两名同学的平均分是92,他们三人的平均分是多少分?
- 2刘华参加演讲比赛,个评委的打分分别是:分、分、分、分、分、分、分。如果去掉一个最高分和一个最低分,刘华的平均得分是多少分?
- 3A group of workers was asked to vote for their favourite food, carrot cake, mee siam and nasi lemak. The pie chart shows…
- 4Danny's scores for 5 games are shown in the table below. | Game | 1st | 2nd | 3rd | 4th | 5th | | :--- | :---: | :---: |…
- 5A group of students had an average of $10. Three students with a sum of $57 joined the group and the average amount of…