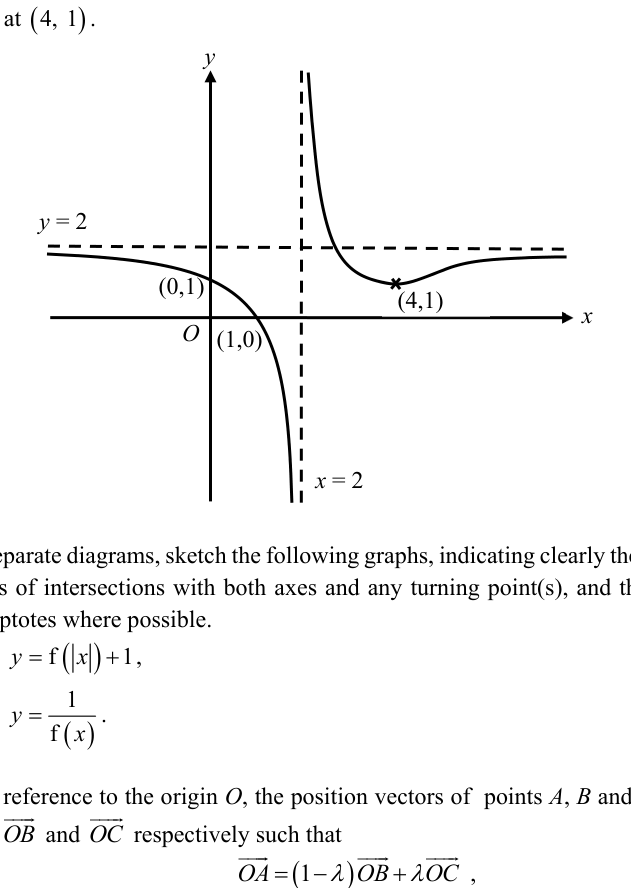
The diagram below shows the graph of . The asymptotes of the graph are and . The graph crosses the -axis at and the -axis at , and has a turning point at . On separate diagrams, sketch the following graphs, indicating clearly the coordinates of any points of intersections with both axes and any turning point(s), and the equations of any asymptotes where possible.
- (i)
,
- (ii)
.
It won't just hand you the answer — it asks where you're stuck.How the checker works
Worked solution
4(i)
1. Determine the effect of the $|x|$ transformation on the key features of the graph.
The transformation means we keep the part of the graph where , and reflect it in the -axis to generate the part for .
- The portion for of the original graph is discarded.
- -intercept: Remains at .
- Turning point: is retained, and its reflection is added.
- Vertical asymptote: is retained, and its reflection is added.
- Horizontal asymptote: is retained (now approached as both and ).
2. Apply the vertical translation to find the final key features for the sketch.
The translates the graph of vertically upwards by unit.
- -intercept: . Because the graph for is decreasing from , reflecting it creates a sharp peak (local maximum) at .
- Minimum turning points: and .
- Vertical asymptotes: Remain at and .
- Horizontal asymptote: .
- -intercepts: The original graph passed through , which translates to . The new graph crosses the -axis closer to the vertical asymptotes (between and , and between and ), but their exact coordinates cannot be algebraically determined so they do not need to be labelled.
A sketch of the even function showing:
- Vertical asymptotes: and
- Horizontal asymptote:
- -intercept / Local maximum: (a sharp peak)
- Minimum turning points: and
- The curve crosses the -axis between and , and between and (exact coordinates not required as they cannot be found).
- The outer branches approach from below as .
4(ii)
1. Determine the equations of the new asymptotes.
- The -intercept of is at . As , , so . This gives a new vertical asymptote at .
- The horizontal asymptote of is . As , , so . This gives a new horizontal asymptote at .
2. Determine the new intercepts and turning point.
- The vertical asymptote of is . As , , so . This gives an -intercept at .
- The -intercept of is , so . The -intercept remains at .
- The local minimum of is at . Taking the reciprocal of the -coordinate gives a local maximum at .
3. Sketch the graph using the deduced features.
- For : The curve approaches from above as , increases through , and goes to as .
- For : The curve comes from as , crosses the -axis at , reaches a local maximum at , and decreases asymptotically to from above as .
A sketched graph consisting of two branches separated by a vertical asymptote at :
- Left branch (): increasing from horizontal asymptote , passing through -intercept , approaching as .
- Right branch (): coming from as , passing through -intercept , reaching a local maximum at , and then decreasing towards horizontal asymptote as .
AI analysis — may contain mistakes.
Worked this one out on paper? Snap your steps and Gigle's AI math checker will circle the step where it went wrong.
More questions on this topic
- 15 (a) Solve the following integral. …
- 2Sketch, on the same diagram, the graphs of and . (You are not required to label any a…
- 3The diagram shows the graphs of and . The graph of has t…
- 4The graph of has a maximum turning point at and passes through the origin. The lines …
- 5On a single diagram, sketch the graphs of and where the following conditions are satisfied, indi…