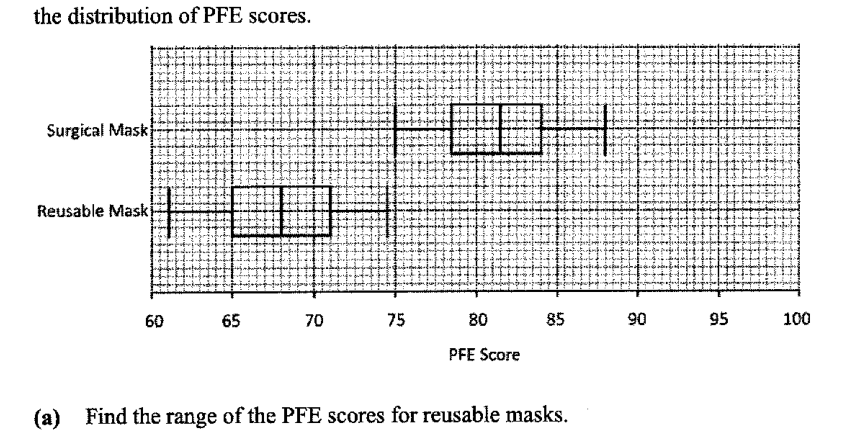
A researcher conducted a Particle Filtration Efficiency (PFE) test on surgical masks and reusable masks which have been used for 24 hours. The box-and-whisker plots represent the distribution of PFE scores.
- (a)
Find the range of the PFE scores for reusable masks.
Answer ...
- (b)
Find the interquartile range of the PFE scores for surgical masks.
Answer ...
- (c)
Make two comparisons between the PFE scores for surgical masks and reusable masks.
1 ...
...
2 ...
...
It won't just hand you the answer — it asks where you're stuck.How the checker works
Worked solution
14(a)
1. Find the range of the reusable mask PFE scores
For reusable masks,
maximum PFE score , minimum PFE score .
14(b)
1. Find the interquartile range using $Q_3-Q_1$
For surgical masks, and .
14(c)
1. Compare the typical PFE scores using the medians
From the box-and-whisker plots,
- median for surgical masks ,
- median for reusable masks .
Since , surgical masks generally have higher PFE scores than reusable masks.
2. Compare the spread of the PFE scores using interquartile ranges
For surgical masks,
For reusable masks,
Since , the middle of surgical mask PFE scores are slightly more spread out than those of reusable masks. Equivalently, reusable masks have the smaller interquartile range.
-
Surgical masks have higher PFE scores than reusable masks, since the median PFE score for surgical masks is , compared with for reusable masks.
-
Surgical masks have less variation in the middle of PFE scores, since their interquartile range is , compared with for reusable masks. Thus reusable masks have the smaller interquartile range.
AI analysis — may contain mistakes.
Worked this one out on paper? Snap your steps and Gigle's AI math checker will circle the step where it went wrong.
More questions on this topic
- 1The masses of two batches of 400 steel bars produced by factory A and B were measured and recorded. The cumulative frequ…
- 2The stem-and-leaf diagram shows the test scores of the boys and girls from a particular class. [Stem-and-leaf diagram pr…
- 3The smallest of a set of five number is an even number and it is prime. The range and the mean is 7. The median is also…
- 4The following stem-and-leaf diagram shows the scores of students in a math test. the median score, Answer ___ the interq…
- 5The marks of a group of 19 students in a test were recorded, as the marks are shown in the stem and leaf diagram. The mo…