The diagram shows the curve . The curve passes through the point and the point , has a turning point at and asymptotes and . Sketch, on separate diagrams, the graphs of
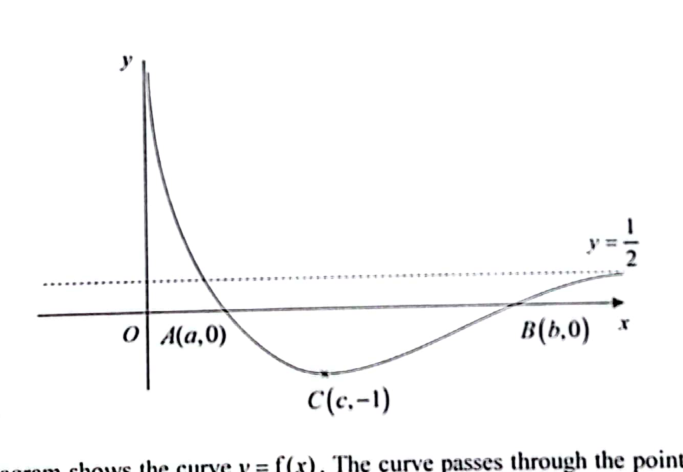
- (a)
,
Label the graph in each case clearly and indicate the equations of the asymptotes and the coordinates of the points corresponding to , and .
- (b)
.
Label the graph in each case clearly and indicate the equations of the asymptotes and the coordinates of the points corresponding to , and .
It won't just hand you the answer — it asks where you're stuck.How the checker works
Worked solution
2(a)
1. Find the coordinates of the points corresponding to $A$, $B$, and $C$.
For a point on , the corresponding point on the transformed graph has coordinates .
- Point
- Point
- Point
2. Determine the equations of the new asymptotes.
- Original horizontal asymptote: as , .
Therefore, . The new horizontal asymptote is . - Original vertical asymptote: as , .
Therefore, . The vertical asymptote remains .
3. Determine the shape of the transformed curve.
- Cusps: The modulus operation creates sharp corners (cusps) at the -intercepts and , where the graph previously crossed the axis smoothly.
- Reflection and Translation: The negative sign in reflects the graph so that it lies entirely below , pointing the cusps upwards. The shifts everything up by 3 units. Therefore, the cusps become sharp local maxima at and .
- Turning Point: The region between and is flipped twice (once by modulus, once by the negative sign), maintaining the smooth local minimum nature at .
- Asymptotic behaviour: The curve rises from near , and eventually decreases from to approach from above.
A sketch of the curve with the following features:
- A vertical asymptote with the curve approaching as .
- A sharp peak (cusp) at the transformed point .
- A smooth local minimum at the transformed turning point .
- Another sharp peak (cusp) at the transformed point .
- A horizontal asymptote , which the curve approaches from above as .
2(b)
1. Determine the coordinates and nature of the turning point corresponding to C.
The point lies on and is a local minimum.
For , substitute and :
Since is negative and has a local minimum at (meaning its magnitude is smallest there), its reciprocal will have the largest negative magnitude. Thus, the corresponding point is a local maximum.
2. Identify the vertical asymptotes corresponding to the points A and B.
The points and are -intercepts of .
When , its reciprocal .
Therefore, there are no coordinate points corresponding to and on the new graph; instead, they correspond to the vertical asymptotes and .
3. Determine the horizontal asymptote and the boundary behavior at the y-axis.
For the horizontal asymptote, as , the given graph shows from below (since it is increasing from the -intercept ).
Thus, as , from above. The equation of the horizontal asymptote is .
For the behavior near the -axis, as , the given graph has a vertical asymptote where .
Thus, . The new graph approaches the origin as an open boundary point.
4. Synthesise the information to sketch the complete graph.
- Draw axes and indicate the asymptotes , , and using dashed lines.
- Plot the local maximum point at and label it.
- Sketch the branch for : starting from an open circle at and curving upwards towards .
- Sketch the branch for : an inverted U-shape passing through , approaching both and downwards.
- Sketch the branch for : a decreasing curve starting from high up near and tapering off to approach from above.
Features to sketch and label:
- Turning point: as a local maximum (corresponding to ).
- Vertical asymptotes: and (corresponding to points and , which do not exist as coordinates on the new curve).
- Horizontal asymptote: .
- Boundary point: Open circle at the origin .
Shape of the curve:
- : Starts from (open circle) and curves upwards, approaching asymptotically ().
- : -shaped; comes from near , reaches a local maximum at , and goes down to near .
- : Starts from near and decreases, approaching from above as .
AI analysis — may contain mistakes.
Worked this one out on paper? Snap your steps and Gigle's AI math checker will circle the step where it went wrong.
More questions on this topic
- 1将函数的图象保持纵坐标不变,先将横坐标缩短为原来的,再向右平移个单位长度后得到,则的解析式为…
- 2By expressing the equation of the curve in the form , where …
- 3A curve has the equation where . Sketch , stating the coordinates of any points o…
- 4The diagram shows the graphs of and . The graph of has t…
- 5The curve with equation is transformed to curve by a translation of …