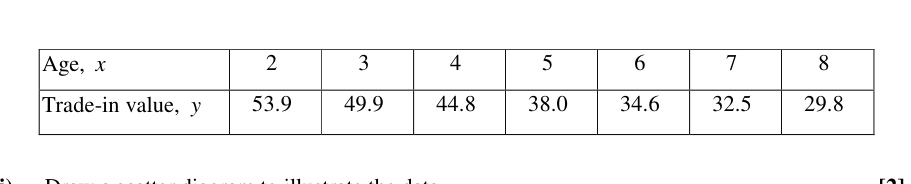
The average trade-in value, y thousand dollars, of a particular make of used car depreciates with the age of the car, x years, according to the following table.
- ((i))
Draw a scatter diagram to illustrate the data.
- ((ii))
Comment on whether a linear model would be appropriate, referring both to the scatter diagram and the context of the question.
- ((iii))
Explain why in this context a quadratic model would probably not be appropriate for long-term predictions.
- ((iv))
Fit a model of the form to the data, and use it to predict the trade-in value of a -year-old car.
It won't just hand you the answer — it asks where you're stuck.How the checker works
Worked solution
7((i))
1. Set up and label the coordinate axes with appropriate scales
Horizontal axis: Label as (Age, years) with a scale covering to .
Vertical axis: Label as (Trade-in value, thousand dollars) with a scale covering (or a broken axis starting from ) to .
2. Plot the given data points
Plot the 7 coordinate points:
.
[A properly scaled scatter diagram with Age on the horizontal axis, Trade-in value on the vertical axis, and the 7 data points correctly plotted.]
7((ii))
1. State whether a linear model is appropriate based on the scatter diagram.
From the scatter diagram (plotted in part (i)), the data points follow a curve rather than a linear trend. Thus, a linear model is not appropriate.
2. State whether a linear model is appropriate based on the context of the question.
In the context of the problem, a linear model would imply a constant rate of depreciation, meaning that for a sufficiently large age , the trade-in value would become negative. Since a car's value cannot be negative, a linear model is inappropriate.
A linear model is not appropriate. From the scatter diagram, the points exhibit a curved pattern rather than a straight line. Contextually, a linear model would eventually predict a negative trade-in value for the car as its age increases, which is practically impossible.
7((iii))
1. State the long-term mathematical behaviour of a quadratic model and relate it to the context.
A quadratic model represents a parabola. For large values of (long-term), if , will eventually start to increase, which contradicts the real-world fact that an aging car's value generally depreciates and does not increase. If , will eventually plunge to take increasingly negative values, which is impossible since a car's value cannot drop below zero. Therefore, a quadratic model is inappropriate.
A quadratic curve is a parabola. For long-term predictions (as gets large), the value will either eventually increase (if the coefficient of is positive) or decrease to negative infinity (if the coefficient is negative), both of which are unrealistic for the depreciating value of a car.
7((iv))
1. Find the equation of the regression line of $\ln y$ on $x$ using a graphing calculator.
By keying the values of and corresponding values of into a graphing calculator, we obtain:
So the fitted model is:
2. Use the regression line to estimate $y$ when $x = 5.5$.
Substitute into the regression equation:
3. State the final predicted value in context.
Since represents the trade-in value in thousands of dollars, the predicted value is (or thousand dollars, correct to 3 s.f.).
(or thousand dollars)
AI analysis — may contain mistakes.
Worked this one out on paper? Snap your steps and Gigle's AI math checker will circle the step where it went wrong.
More questions on this topic
- 1A teacher conducts a survey on 7 students to investigate the relationship between the number of hours () of "screen-t…
- 2The number of years () an employee has worked for the company and the corresponding salary increment, in dollars (…
- 3It is believed that the probability of a randomly chosen pregnant woman giving birth to a Down's Syndrome child is r…
- 4In an experiment, the time taken, minutes, for a 1-kg block of ice to melt completely under 7 pre-determined tempera…
- 5An electrical appliance supplier is investigating the potential impact of monthly advertisement expenditure, denoted as…