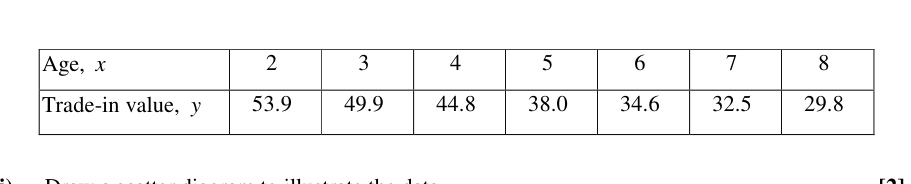
某种特定品牌二手车的平均折旧价值为 千美元,其折旧情况随车龄 年的变化如下表所示。
- ((i))
绘制散点图来展示数据。
- ((ii))
结合散点图 and 问题背景,评述线性模型是否合适。
- ((iii))
解释为什么在这种背景下,二次模型可能不适合进行长期预测。
- ((iv))
将 形式的模型拟合到数据中,并用它来预测一辆车龄为 年的汽车的折旧价值。
它不会直接告诉你答案,而是问你卡在哪一步看看 AI 是怎么陪你一步步弄懂这道题的
完整解法
7((i))
1. Set up and label the coordinate axes with appropriate scales
Horizontal axis: Label as (Age, years) with a scale covering to .
Vertical axis: Label as (Trade-in value, thousand dollars) with a scale covering (or a broken axis starting from ) to .
2. Plot the given data points
Plot the 7 coordinate points:
.
[A properly scaled scatter diagram with Age on the horizontal axis, Trade-in value on the vertical axis, and the 7 data points correctly plotted.]
7((ii))
1. State whether a linear model is appropriate based on the scatter diagram.
From the scatter diagram (plotted in part (i)), the data points follow a curve rather than a linear trend. Thus, a linear model is not appropriate.
2. State whether a linear model is appropriate based on the context of the question.
In the context of the problem, a linear model would imply a constant rate of depreciation, meaning that for a sufficiently large age , the trade-in value would become negative. Since a car's value cannot be negative, a linear model is inappropriate.
A linear model is not appropriate. From the scatter diagram, the points exhibit a curved pattern rather than a straight line. Contextually, a linear model would eventually predict a negative trade-in value for the car as its age increases, which is practically impossible.
7((iii))
1. State the long-term mathematical behaviour of a quadratic model and relate it to the context.
A quadratic model represents a parabola. For large values of (long-term), if , will eventually start to increase, which contradicts the real-world fact that an aging car's value generally depreciates and does not increase. If , will eventually plunge to take increasingly negative values, which is impossible since a car's value cannot drop below zero. Therefore, a quadratic model is inappropriate.
A quadratic curve is a parabola. For long-term predictions (as gets large), the value will either eventually increase (if the coefficient of is positive) or decrease to negative infinity (if the coefficient is negative), both of which are unrealistic for the depreciating value of a car.
7((iv))
1. Find the equation of the regression line of $\ln y$ on $x$ using a graphing calculator.
By keying the values of and corresponding values of into a graphing calculator, we obtain:
So the fitted model is:
2. Use the regression line to estimate $y$ when $x = 5.5$.
Substitute into the regression equation:
3. State the final predicted value in context.
Since represents the trade-in value in thousands of dollars, the predicted value is (or thousand dollars, correct to 3 s.f.).
(or thousand dollars)
AI 分析,可能出错
用 AI 批改,圈出写错的那一步,并自动将你的薄弱点存入错题本,形成你的错因库。
同一知识点的其他题
- 1一位教师对7名学生进行了调查,以研究每周“屏幕时间”小时数()与他们在最近结束的考试中获得的平均分数()之间的关系。她将自己的调查结果记录在下表中。 已知 对 的回归线为 …
- 2下表给出了某员工在公司工作的年数()以及该员工获得的相应薪资增幅(以美元计,)。 | 年数, | 6 | 7 | 9 | 11 | 13 | 15 | 18 | |---|---|---|---|---|---|---|…
- 3据信,随机选择的孕妇生育唐氏综合征患儿的概率 与孕妇的年龄 (以岁为单位)相关。下表给出了 5 个不同的 值所对应的 的观测值。 | | 25 | 30 | 35 | 40 | 45 | |---|--…
- 4在一项实验中,记录了 1 kg 冰块在 7 种预设温度 下完全融化所需的时间 分钟,如下表所示。 艾伯特(Albert)分析了这些数据并得出以下结论: 积矩相关系数,…
- 5一家电器供应商正在调查在流行社交媒体平台 SnapGram 上的月度广告支出(记为 ,单位为千美元)对其月销售利润(记为 ,单位为千美元)的潜在影响。该供应商收集了过去一年中的以下数据。 这组数据被认为可以用以下方程之一进行建模…