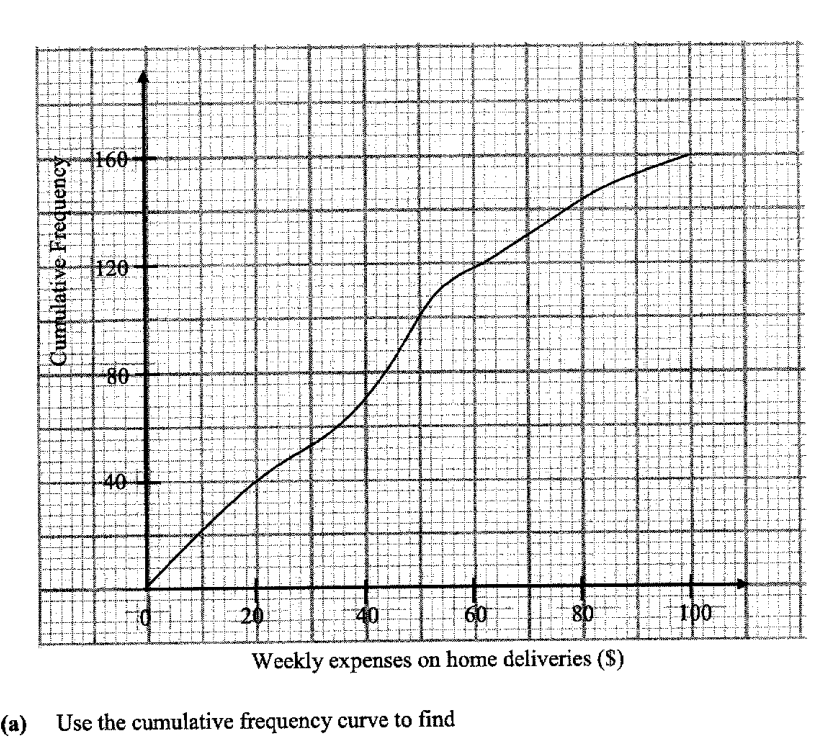
The cumulative frequency curve shows the weekly expenditure on home deliveries of 160 households from Block W.
- (a)
Use the cumulative frequency curve to find
- (i)
the median of the distribution,
Answer $...
- (ii)
the interquartile range of the distribution,
Answer $...
- (iii)
the value of p, given that p% of the residents spent more than $84 weekly on home deliveries.
Answer p = ...
- (i)
- (b)
The weekly expenditure on home deliveries of a group of 160 residents from Block K are displayed in the box and whisker plot below.
Here are two statements comparing the weekly expenditure on home deliveries of the residents from Block W and Block K.
For each statement, state whether you agree or disagree.
Give a reason for each answer, stating clearly which statistic you used to make your decision.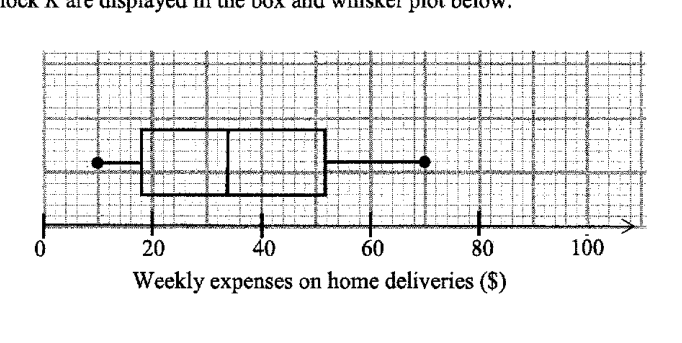
- (i)
On average, the residents in Block W has lower weekly expenses on home deliveries than the residents in Block K.
Answer I ...because...
- (ii)
The weekly expenditure on home deliveries of the residents in Block K is closer to the median than the weekly expenditure on home deliveries of the residents from Block W.
Answer I ...because...
- (i)
It won't just hand you the answer — it asks where you're stuck.How the checker works
Worked solution
No solution to show yet.
Worked this one out on paper? Snap your steps and Gigle's AI math checker will circle the step where it went wrong.
More questions on this topic
- 1The masses of two batches of 400 steel bars produced by factory A and B were measured and recorded. The cumulative frequ…
- 2The stem-and-leaf diagram shows the test scores of the boys and girls from a particular class. [Stem-and-leaf diagram pr…
- 3The cumulative frequency graph shows distribution of the waiting times before being served, in minutes, of 60 customers…
- 4The waiting time, t in minutes, for 40 customers at two phone service shops, Shop A and Shop B, are as follows. Calculat…
- 5The temperatures of eighteen girls in a class on a particular day are shown in the stem-and-leaf diagram. (Stem-and-leaf…