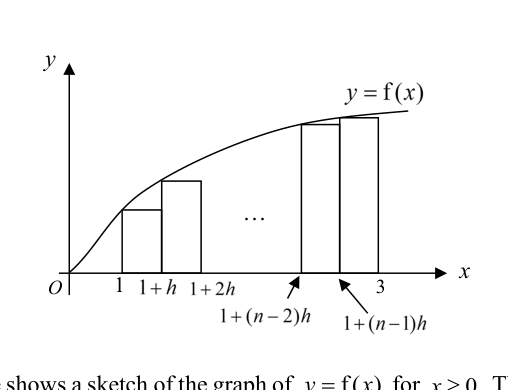
The diagram above shows a sketch of the graph of for . There are rectangles each of width drawn under the curve for . Each rectangle when rotated through radians about the x-axis, will result in a cylindrical disc. The total volume of the cylindrical discs , can be used to estimate the volume , which is the actual volume generated when the region bounded by the curve, the lines and , and the x-axis is rotated through radians about the x-axis.
- (a)
Show that , the total volume of the cylindrical discs, is given by State the value of in terms of .
- (b)
From the above diagram, it can be observed that . Write down , a similar expression as where .
- (It is now given that $f(x) = \dfrac{x^2}{\sqrt{1+e^x}}$ for $x \ge 0.$)
- (c)
Find the value of
- (d)
Find the area of the region bounded by and another curve with equation for .
- (c)
It won't just hand you the answer — it asks where you're stuck.How the checker works
Worked solution
10(b)
1. Formulate the sum for the upper rectangles to overestimate the volume.
For , the cylindrical discs must overestimate the volume. Since the curve is increasing on the interval , we must construct the rectangles using the right endpoints of each sub-interval. The radius of each disc will therefore be for .
The volume of each disc is .
Summing these discs gives:
10(It is now given that $f(x) = \dfrac{x^2}{\sqrt{1+e^x}}$ for $x \ge 0.$)(c)
1. Relate the limit of the Riemann sum to the definite integral for the volume of revolution.
As , the limit of the Riemann sum gives the exact volume of revolution about the -axis.
2. Substitute the given function and evaluate the integral using a graphing calculator.
Substitute :
Evaluating this definite integral using a graphing calculator:
10(It is now given that $f(x) = \dfrac{x^2}{\sqrt{1+e^x}}$ for $x \ge 0.$)(d)
1. Express the given equation of the second curve as a function of $x$.
Since , we take the negative square root to represent the lower semicircle:
2. Find the $x$-coordinates of the intersection points between the two curves using a graphing calculator.
Let and .
Equating and solving using a graphing calculator yields the intersection points:
3. Set up the definite integral for the enclosed area.
Observing the graphs on the GC, the curve lies above in the interval . The area is given by:
4. Evaluate the definite integral using the graphing calculator.
Evaluating the definite integral directly with the graphing calculator:
AI analysis — may contain mistakes.
Worked this one out on paper? Snap your steps and Gigle's AI math checker will circle the step where it went wrong.
More questions on this topic
- 1The curve is defined by the parametric equations , , . The point…
- 2The diagram shows the graph of . The curve has a turning point at and the lines are asymp…
- 3You are given that and …
- 4A function f is defined as Find the volume of revolution when the region bounded by the curve of…
- 5By using the substitution , find . The region is boun…