A game has two sets of eight icons. One icon from each set is randomly chosen to be displayed on each turn, starting with set 1. The icons for each set are as follows. For example, if a three-interlocking-circles icon is chosen from set 1 and a sailing-boat icon is chosen from set 2, the display would be (three-interlocking-circles)(sailing-boat).
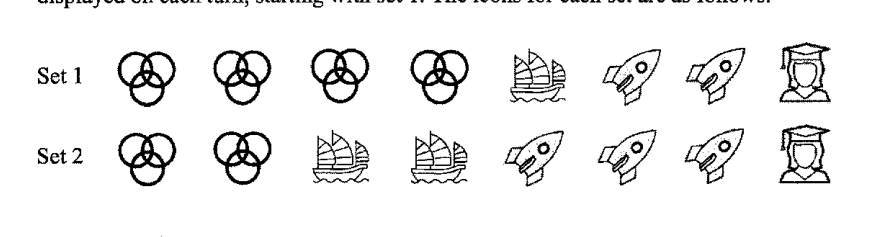
- (a)
Find the probability that, on one turn,
- (i)
a three-interlocking-circles icon from set 1 and a three-interlocking-circles icon from set 2 (i.e. (three-interlocking-circles)(three-interlocking-circles)) is displayed.
Answer ...
- (ii)
at least one three-interlocking-circles icon is displayed.
Answer ...
- (i)
- (b)
The game is now programmed such that no two same icons will appear in the display.
For example, if an (three-interlocking-circles) icon is chosen in set 1, this icon will be removed from set 2 and an icon will be randomly chosen from the remaining six icons in set 2 as shown in the diagram below.
If now an (graduation-cap) icon is chosen in set 2, the display would be (three-interlocking-circles)(graduation-cap).
Draw a tree diagram to show the probabilities of all the possible outcomes.
It won't just hand you the answer — it asks where you're stuck.How the checker works
Worked solution
23(a)(i)
1. Find the probability of getting the required icon from each set and multiply them.
Set 1 has three-interlocking-circles icons out of icons.
Set 2 has three-interlocking-circles icons out of icons.
23(a)(ii)
1. Find the probability that no three-interlocking-circles icon is chosen from either set.
Set 1 has non-three-interlocking-circles icons out of , and Set 2 has non-three-interlocking-circles icons out of .
2. Use the complement to find the probability of at least one three-interlocking-circles icon.
23(b)
1. Write the first-stage probabilities for choosing each icon from Set 1.
Let
= three-interlocking-circles, = sailing-boat, = rocket, = graduation-cap.
Set 1 has , out of icons.
So the first branches are
2. Find the second-stage probabilities after each possible Set 1 choice, removing the same icon type from Set 2.
Set 2 originally has .
If is chosen from Set 1, remove from Set 2. Remaining: , total .
If is chosen from Set 1, remove from Set 2. Remaining: , total .
If is chosen from Set 1, remove from Set 2. Remaining: , total .
If is chosen from Set 1, remove from Set 2. Remaining: , total .
3. Present the complete tree diagram structure with all possible non-matching displayed pairs.
The tree diagram should show:
No branch has the same icon in both positions.
Tree diagram probabilities:
- Set 1: :
- Set 2: : , : , :
- Set 1: :
- Set 2: : , : , :
- Set 1: :
- Set 2: : , : , :
- Set 1: :
- Set 2: : , : , :
where = three-interlocking-circles, = sailing-boat, = rocket, = graduation-cap.
AI analysis — may contain mistakes.
Worked this one out on paper? Snap your steps and Gigle's AI math checker will circle the step where it went wrong.
More questions on this topic
- 1The masses of two batches of 400 steel bars produced by factory A and B were measured and recorded. The cumulative frequ…
- 2A bag contains 4 black coins, 7 red coins and 11 white coins. Two coins are drawn from the bag at random, one after anot…
- 3A bag contains 12 balls. 2 of the balls are red, n are green balls and the rest are blue balls. Eunice takes two balls f…
- 4A survey was carried out to find out the number of emails received in a week by each of a group of students. The table b…
- 5The cumulative frequency curve shows the marks obtained by the 120 students in a recent Mathematics Test. The maximum ma…