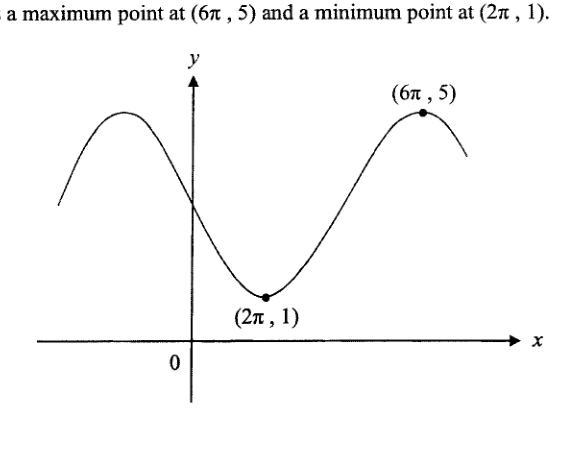
图示为 的部分图像。 该图像在 处有一个极大值点,在 处有一个极小值点。 求常数 、 和 的值。
它不会直接告诉你答案,而是问你卡在哪一步看看 AI 是怎么陪你一步步弄懂这道题的
完整解法
4
1. Find the value of $c$ using the maximum and minimum values.
The value of is the vertical shift, which is the average of the maximum and minimum -values:
2. Find the period of the graph and use it to determine $b$.
The horizontal distance between a minimum and the consecutive maximum is half a period.
The period of is given by (assuming ).
3. Find the value of $a$ using the amplitude and a point on the graph.
The amplitude is half the difference between the maximum and minimum -values:
Substitute the minimum point into the equation :
答案
, ,
AI 分析,可能出错
用 AI 批改,圈出写错的那一步,并自动将你的薄弱点存入错题本,形成你的错因库。
同一知识点的其他题
- 1写出 的主值范围。 下方显示了在 弧度范围内的曲线 。 该曲线的极大值点为 …
- 2下图展示了一段允许光波通过的塑料光纤电缆。光波的路径可以用三角函数建模。 已知电缆的直径为 4 毫米。 求光波的振幅。 此外,已知该光波的周期为 500 纳米。 求图中所示电缆部分的长度。 以下哪一个可以作为该光波的合适模型? …
- 3图中展示了一个叶片长度为 的风力发电机。风力发电机的中心距离地面 。在离开 点 秒后,特定叶片尖端距离地面的高度 可建模为 …
- 4图中显示了对于 弧度,曲线 的图像。 图中指出了一个极小值点 和一个极大值点 …
- 5一只时钟安装在建筑物屋顶的垂直墙壁上。 从时钟中心 到分针尖端 的距离为 15 米。 距离屋顶的高度 (米)由 给出,其中 是超过整点的分钟数。 距离屋顶…