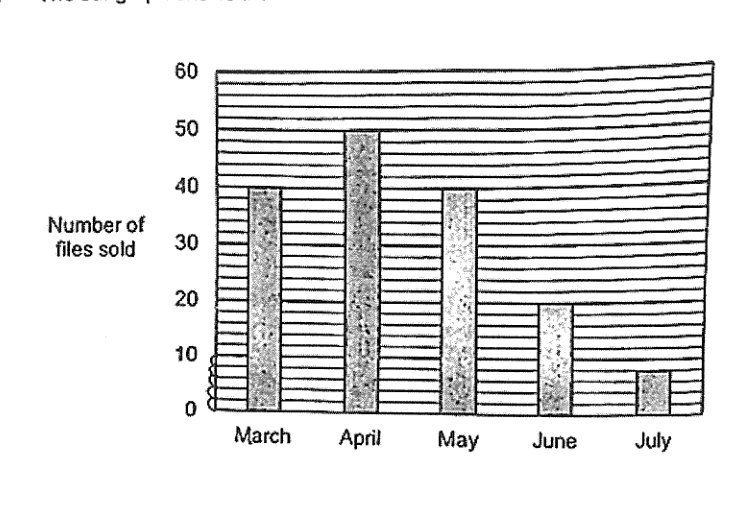
该条形图显示了从3月到7月售出的文件数量。 在以下哪个月份中,售出文件数量的百分比变化最大?
它不会直接告诉你答案,而是问你卡在哪一步看看 AI 是怎么陪你一步步弄懂这道题的
完整解法
15
1. Read the number of files sold for each month from the bar graph
March:
April:
May:
June:
July:
2. Calculate the percentage change from March to April
Change =
Percentage change =
3. Calculate the percentage change from April to May
Change =
Percentage change =
4. Calculate the percentage change from May to June
Change =
Percentage change =
5. Calculate the percentage change from June to July
Change =
Percentage change =
6. Compare the percentage changes to find the greatest
The percentage changes are , , , and .
The greatest percentage change is , which occurred from June to July.
答案
June to July (option 4)
AI 分析,可能出错
用 AI 批改,圈出写错的那一步,并自动将你的薄弱点存入错题本,形成你的错因库。
同一知识点的其他题
- 1一根绳子长米,也就是米. ___ 判断对错
- 2Hamid 贷款买车,贷款期限为 3 年,年单利利率为 3.5%。 如果 Hamid 支付的总利息为 $10 374,求他贷款的金额。 答案 $ ... 下表显示了 Hamid 收集的关于他在 2023 年驾驶情况的信息。 | 描述 |…
- 3| 纸箱 | 玩具数量 | 缺陷玩具百分比 | | :--- | :---: | :---: | | A | 200 | 3% | | B | 300 | 8% | 在纸箱 A 和 B 的所有玩具中,缺陷玩具占百分之几?
- 4某商场进行促销活动,对一些商品打折出售,妈妈在商场花了 240 元买了一件衣服,比原价便宜了 60 元。这件衣服是打( )折出售的。 A. 二五 B. 四 C. 五 D. 八
- 5: