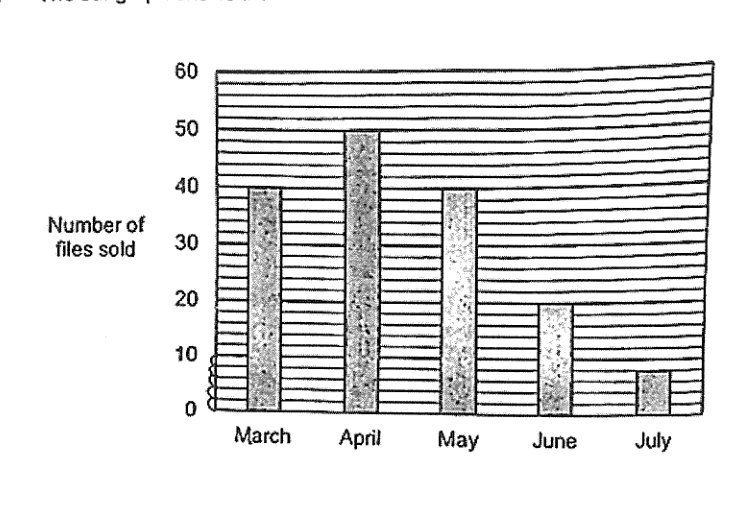
The bar graph shows the number of files sold from March to July. In which of the following months was the percentage change in the number of files sold the greatest?
It won't just hand you the answer — it asks where you're stuck.How the checker works
Worked solution
15
1. Read the number of files sold for each month from the bar graph
March:
April:
May:
June:
July:
2. Calculate the percentage change from March to April
Change =
Percentage change =
3. Calculate the percentage change from April to May
Change =
Percentage change =
4. Calculate the percentage change from May to June
Change =
Percentage change =
5. Calculate the percentage change from June to July
Change =
Percentage change =
6. Compare the percentage changes to find the greatest
The percentage changes are , , , and .
The greatest percentage change is , which occurred from June to July.
June to July (option 4)
AI analysis — may contain mistakes.
Worked this one out on paper? Snap your steps and Gigle's AI math checker will circle the step where it went wrong.
More questions on this topic
- 1一根绳子长米,也就是米. ___ 判断对错
- 2Hamid borrowed a sum of money for 3 years at an interest rate of 3.5% per annum simple interest to pay for his car. If t…
- 3| Carton | Number of toys | Percentage of toys which are defective | | :--- | :---: | :---: | | A | 200 | 3% | | B | 300…
- 4某商场进行促销活动,对一些商品打折出售,妈妈在商场花了 240 元买了一件衣服,比原价便宜了 60 元。这件衣服是打( )折出售的。 A. 二五 B. 四 C. 五 D. 八
- 5: