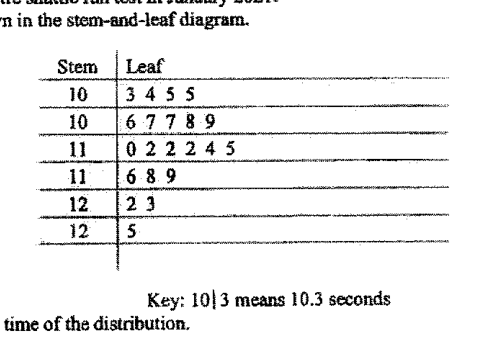
21 girls took a 40-metre shuttle run test in January 2021. The timings are shown in the stem-and-leaf diagram.
- (a)
Find the median time of the distribution.
Answer ___ s
- (b)
Find the interquartile range.
Answer ___ s
- (c)
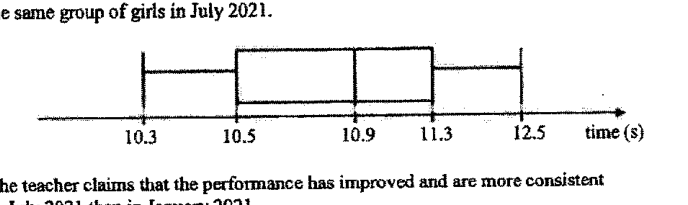
The box-and-whisker plot shows the distribution of the timings obtained by the same group of girls in July 2021.
The teacher claims that the performance has improved and are more consistent in July 2021 than in January 2021.
Explain if this statement is true.
Answer ___
It won't just hand you the answer — it asks where you're stuck.How the checker works
Worked solution
18(a)
1. Find the position of the median and read the corresponding value from the ordered stem-and-leaf diagram.
There are data values.
Median position th value.
Counting from the smallest value in the stem-and-leaf diagram, the 11th value is .
So the median time is s.
s
18(b)
1. Find the positions of the lower and upper quartiles for 21 data values.
There are timings.
The median is the th value, so exclude the median and split the remaining values into two halves of values each.
is the median of the first values, so it is the mean of the th and th values.
is the median of the last values, so it is the mean of the th and th values.
2. Read the quartiles and calculate the interquartile range.
From the ordered stem-and-leaf diagram:
th value , th value
th value , th value
s
18(c)
1. Compare the median times to decide whether performance improved.
January median s.
July median s.
Since a shorter time means better performance and , the performance improved in July.
2. Compare the interquartile ranges to decide whether the timings were more consistent.
January interquartile range s.
For July,
Since , the July timings were less spread out and hence more consistent.
The statement is true. The median time decreased from s in January to s in July, so performance improved. The interquartile range decreased from s in January to s in July, so the timings were more consistent in July.
AI analysis — may contain mistakes.
Worked this one out on paper? Snap your steps and Gigle's AI math checker will circle the step where it went wrong.
More questions on this topic
- 1某班第二组女生参加体育测试,仰卧起坐的成绩(单位:个)如下:43、41、39、40、37.这组数据的中位数是 .
- 2车间生产同一种产品,某一星期日产量的情况如下:有天是件,有天是件,有天是件,那么车间这个星期日产量的众数是 ___.
- 3The stem-and-leaf diagram shows the test scores of the boys and girls from a particular class. [Stem-and-leaf diagram pr…
- 4有三个数5,x,9,它们的平均数为6,则x为 .
- 5The smallest of a set of five number is an even number and it is prime. The range and the mean is 7. The median is also…