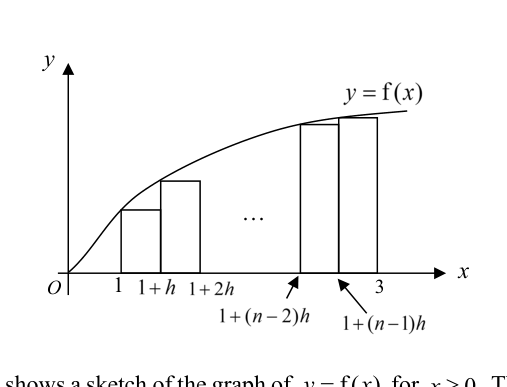
The diagram above shows a sketch of the graph of for . There are rectangles each of width drawn under the curve for . Each rectangle when rotated through radians about the x-axis, will result in a cylindrical disc. The total volume of the cylindrical discs , can be used to estimate the volume , which is the actual volume generated when the region bounded by the curve, the lines and , and the x-axis is rotated through radians about the x-axis. It is now given that for .
- (a)
Show that , the total volume of the n cylindrical discs, is given by . State the value of h in terms of n.
- (b)
From the above diagram, it can be observed that . Write down , a similar expression as where .
- (c)
Find the value of .
- (d)
Find the area of the region bounded by and another curve with equation , for .
It won't just hand you the answer — it asks where you're stuck.How the checker works
Worked solution
10(a)
1. Write the volume of the r-th cylindrical disc
The -th rectangle () has left edge at , so its height (the radius when rotated) is and its thickness is . Rotating it through gives a cylinder of volume
2. Sum the n discs to obtain V1
Adding the volumes of all discs:
since and are common to every term.
3. State h in terms of n
The rectangles of equal width exactly cover , a total width of . Hence
(Here the multiplier, with , is the form needed; the printed "" is read as .)
10(b)
1. Formulate the upper sum (right Riemann sum) by shifting the index to the right endpoints.
Since the function is increasing for , the left-endpoint rectangles are inscribed (, underestimating the volume). The right-endpoint rectangles will be circumscribed, giving an overestimation ().
The volume of each right-endpoint cylindrical disc is .
To sum these right-endpoint discs, we change the summation indices to run from to instead of to .
10(c)
1. Recognise that the limit of the Riemann sum as $n \to \infty$ is the definite integral representing the actual volume
As , the total volume of the cylindrical discs approaches the actual volume generated by rotating the region under the curve about the -axis.
2. Substitute $f(x)$ into the integral and evaluate using a graphing calculator
Using a graphing calculator to evaluate the definite integral:
10(d)
1. Express the equation of the given curve explicitly in terms of $x$ for the condition $y \le 3$.
Taking the square root on both sides, and given that (which means ):
2. Find the $x$-coordinates of the points of intersection between the two curves using a graphing calculator.
Equating the two functions to find their intersection points:
Using a graphing calculator to solve for :
3. Set up the definite integral for the area of the bounded region and evaluate it using a graphing calculator.
From the graphs, the curve lies above the semicircle between the points of intersection. The bounded area is given by:
Using a graphing calculator to evaluate the definite integral:
AI analysis — may contain mistakes.
Worked this one out on paper? Snap your steps and Gigle's AI math checker will circle the step where it went wrong.
More questions on this topic
- 1The diagram above shows a sketch of the graph of for . There are rectangles each of width dra…
- 2Find the exact value of . The diagram shows a sketch of the curve …
- 3Find Using the substitution , find …
- 4The graph of is shown in the diagram below. By considering the shaded rectangle, show that …
- 5Let . Show that . Th…