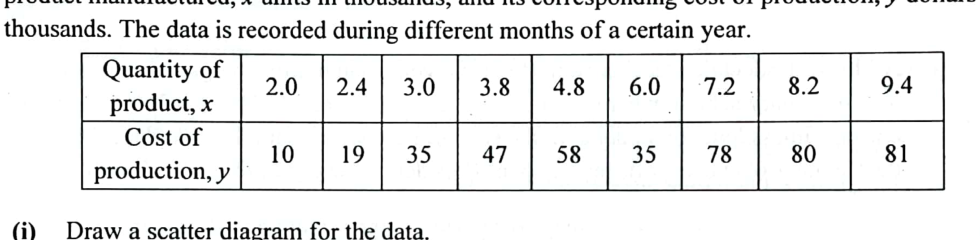
A factory manufactures a certain product for sale. The following table gives the quantity of product manufactured, x units in thousands, and its corresponding cost of production, y dollars in thousands. The data is recorded during different months of a certain year.
- (i)
Draw a scatter diagram for the data.
- (ii)
One of the values of y appears to be incorrect.
Indicate the corresponding point in your diagram by labelling it P.
- (iii)
Remove P from the set of data.
By using the scatter diagram for the remaining points, explain whether or is the better model for the relationship between x and y.
- (iv)
Using the better model chosen in part (iii), find the product moment correlation coefficient and the equation of a suitable regression line.
Explain what happens to the product moment correlation coefficient and the equation of the regression line if the factory decides to include a fixed cost of M thousand dollars for purchasing a packing machine to the cost of production, y.
- (v)
Use the regression line found in part (iv) to estimate the cost of production when the quantity produced is 6000 units and comment on its reliability.
It won't just hand you the answer — it asks where you're stuck.How the checker works
Worked solution
8(i)
1. Set up and label the axes with appropriate scales
Draw the horizontal axis for (Quantity of product, in thousands) with a range covering to , e.g., to .
Draw the vertical axis for (Cost of production, in thousands) with a range covering to , e.g., to .
Label both axes clearly.
2. Plot all the given data points
Plot the following 9 points accurately on the grid:
[A scatter diagram drawn with appropriately scaled axes, with the 9 data points correctly plotted.]
8(ii)
1. Identify the incorrect point from the data trend.
Observing the data table, as the quantity increases, the cost generally increases. However, at , the value is unexpectedly low compared to the surrounding values ( at and at ). Thus, is the outlier and should be labelled on the scatter diagram.
Point is .
8(iii)
1. Identify the shape of the data on the scatter diagram and conclude the better model
From the scatter diagram of the remaining points, it can be observed that as increases, increases at a decreasing rate. The points lie on a curve (concave downwards) rather than a straight line.
Therefore, a logarithmic model fits the shape of the data better than a linear model.
is the better model because the points on the scatter diagram curve such that as increases, increases at a decreasing rate.
8(iv)
1. Calculate the product moment correlation coefficient for the better model ($y=a+b\ln x$) using the remaining data.
From part (iii), the better model is .
Excluding the outlier , we use the remaining 8 data points:
: 2.0, 2.4, 3.0, 3.8, 4.8, 7.2, 8.2, 9.4
: 10, 19, 35, 47, 58, 78, 80, 81
Using a graphing calculator to find the correlation between and :
(3 s.f.)
2. Find the equation of the suitable regression line.
Since we use the model to estimate the cost from the quantity produced , the suitable regression line is the line of on .
From the graphing calculator, the coefficients for are:
Equation of the regression line:
(3 s.f.)
3. Explain the effect of adding a fixed cost $M$ on the product moment correlation coefficient.
Including a fixed cost of translates the new cost to .
Since adding a constant is a linear translation of the variable , the linear association and spread between and are unaffected.
Therefore, the product moment correlation coefficient remains unchanged.
4. Explain the effect of adding a fixed cost $M$ on the equation of the regression line.
Substituting into the original regression model gives:
The equation of the regression line has its -intercept increased by (it is translated vertically upwards by thousand dollars).
The product moment correlation coefficient remains unchanged.
The equation of the regression line will have its -intercept increased by .
8(v)
1. Calculate the estimated cost using the regression line from part (iv).
Since the quantity produced is units and is in thousands, we substitute .
Using the logarithmic regression line obtained in part (iv) (from the data excluding the outlier ):
Since is the cost in thousands of dollars, the estimated cost is , which is (to 3 s.f.).
2. Comment on the reliability of the estimate.
The estimate is reliable because:
- lies within the range of given data values (), so this is an interpolation.
- The product moment correlation coefficient calculated in part (iv) () is very close to , indicating that the data points fit the logarithmic model very strongly.
Estimated cost is . The estimate is reliable.
AI analysis — may contain mistakes.
Worked this one out on paper? Snap your steps and Gigle's AI math checker will circle the step where it went wrong.
More questions on this topic
- 1A teacher conducts a survey on 7 students to investigate the relationship between the number of hours () of "screen-t…
- 2The number of years () an employee has worked for the company and the corresponding salary increment, in dollars (…
- 3It is believed that the probability of a randomly chosen pregnant woman giving birth to a Down's Syndrome child is r…
- 4In an experiment, the time taken, minutes, for a 1-kg block of ice to melt completely under 7 pre-determined tempera…
- 5An electrical appliance supplier is investigating the potential impact of monthly advertisement expenditure, denoted as…