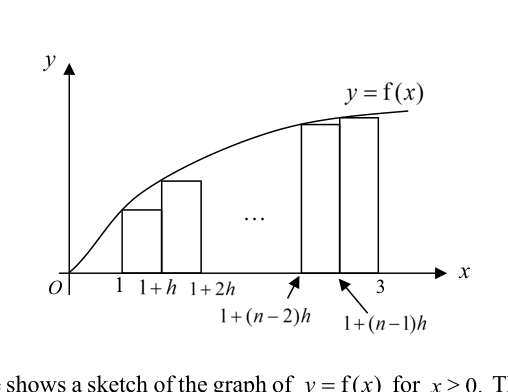
The diagram above shows a sketch of the graph of for . There are rectangles each of width drawn under the curve for . Each rectangle when rotated through radians about the -axis, will result in a cylindrical disc. The total volume of the cylindrical discs , can be used to estimate the volume , which is the actual volume generated when the region bounded by the curve, the lines and , and the -axis is rotated through radians about the -axis.
- (a)
Show that , the total volume of the cylindrical discs, is given by .
State the value of in terms of .
- (b)
From the above diagram, it can be observed that . Write down , a similar expression as where .
- (c)
It is now given that for .
Find the value of .
- (d)
Find the area of the region bounded by and another curve with equation , for .
It won't just hand you the answer — it asks where you're stuck.How the checker works
Worked solution
10(a)
1. Express the volume of the cylindrical disc formed by the rectangle at index $r$.
For the rectangle corresponding to index (where ), its left edge is at .
The height of this rectangle is .
When rotated radians about the -axis, it forms a cylindrical disc of radius and thickness .
The volume of this single disc is .
2. Sum the volumes of all $n$ discs to show the expression for $V_1$.
To find the total volume , we sum the volumes of all discs from to :
Factoring out the constants and gives:
3. Determine the value of $h$ in terms of $n$.
The region spans from to , so the total width of the interval is .
Since there are rectangles of equal width , we have:
10(b)
1. Identify the geometrical requirement for an overestimate
From the diagram, the curve is an increasing function. uses the left-hand endpoint of each subinterval (from to ), which leaves a gap under the curve, hence .
To create an overestimate (), we must use rectangles whose heights are determined by the right-hand endpoint of each subinterval.
2. Write the new expression using right-hand endpoints
The right-hand endpoints of the intervals occur at for .
Replacing the summation limits in to reflect these new evaluation points gives:
10(c)
1. Relate the limit of the Riemann sum to the definite integral for the exact volume of revolution.
As , the width of each cylinder . The limit of the Riemann sum representing the total volume of the cylindrical discs corresponds to the exact volume of the solid of revolution.
2. Substitute the given function and evaluate the integral using a graphing calculator.
Substitute into the integral:
Using a graphing calculator to evaluate the definite integral:
10(d)
1. Express the equation of the second curve with $y$ as the subject.
\n\n\nSince it is given that , we must take the negative square root to represent the lower semicircle:\n
2. Find the $x$-coordinates of the points of intersection.
Using a graphing calculator, we find the points of intersection between and the lower semicircle for .\n
3. Formulate the definite integral for the area and evaluate it using a graphing calculator.
Observe from the graphing calculator that the curve lies above the semicircle between the intersection points.\n\nEvaluating this via the graphing calculator gives:\n
AI analysis — may contain mistakes.
Worked this one out on paper? Snap your steps and Gigle's AI math checker will circle the step where it went wrong.
More questions on this topic
- 1The diagram above shows a sketch of the graph of for . There are rectangles each of width dra…
- 2Find the exact value of . The diagram shows a sketch of the curve …
- 3Find Using the substitution , find …
- 4The graph of is shown in the diagram below. By considering the shaded rectangle, show that …
- 5Let . Show that . Th…