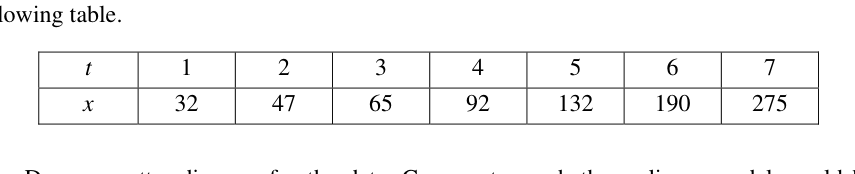
The Department of Environmental Health did a research on how the number of mosquitoes, x, in a container varies with time, t. Observations on successive days give the data shown in the following table.
- (i)
Draw a scatter diagram for the data. Comment on whether a linear model would be appropriate.
- (ii)
It is given that x can be modelled by , where a and b are constants. Find the equation of the least squares regression line of on t. Hence calculate the estimates of a and b.
- (iii)
Calculate an estimate for the number of mosquitoes in the container if the experiment has lasted for 30 days.
- (iv)
Comment on the reliability of your answer in part (iii).
It won't just hand you the answer — it asks where you're stuck.How the checker works
Worked solution
11(i)
1. Draw the scatter diagram.
Plot the points , , , , , , and on a Cartesian plane with on the horizontal axis and on the vertical axis.
(A graph with appropriate scales is drawn and points are marked)
2. Comment on the appropriateness of a linear model based on the shape of the scatter diagram.
Observing the plotted points, the increments in get larger as increases, causing the points to form a curve that bends upwards rather than scattering around a straight line.
Therefore, a linear model is not appropriate.
(Scatter diagram plotted)
A linear model would not be appropriate as the points lie on a curve rather than a straight line.
11(ii)
1. Linearise the given exponential model by taking the natural logarithm on both sides.
We are given the exponential model .
Taking the natural logarithm on both sides yields:
This represents a linear relationship between and , where the gradient is and the vertical intercept is .
2. Use a graphing calculator to find the least squares regression line of $\ln x$ on $t$.
Using a graphing calculator, we perform a linear regression of on with the transformed data points :
, , , , , ,
The calculator gives the least squares regression line:
3. Equate the line's intercept and gradient to $\ln a$ and $b$ to find the estimates of $a$ and $b$.
Comparing the regression line equation with , we equate the corresponding coefficients:
Gradient (to 3 s.f.)
Intercept
11(iii)
1. Substitute $t = 30$ into the least squares regression equation from part (ii).
From part (ii), the least squares regression line is (taking values to 5 significant figures for intermediate accuracy).
When ,
2. Solve for $x$ to find the estimated number of mosquitoes.
11(iv)
1. State that the estimate is unreliable and provide the statistical reason based on the data range.
The estimate is not reliable because is well outside the given data range (). This is an extrapolation.
2. Provide a contextual reason for the unreliability.
In reality, the exponential growth model is unlikely to hold over a long period of 30 days due to limited resources (like space and food) in the container.
The estimate is not reliable. is far outside the given data range of , making this an extrapolation. It is unlikely that the number of mosquitoes will continue to grow exponentially indefinitely due to environmental constraints (e.g. limited space and food in the container).
AI analysis — may contain mistakes.
Worked this one out on paper? Snap your steps and Gigle's AI math checker will circle the step where it went wrong.
More questions on this topic
- 1A teacher conducts a survey on 7 students to investigate the relationship between the number of hours () of "screen-t…
- 2The number of years () an employee has worked for the company and the corresponding salary increment, in dollars (…
- 3It is believed that the probability of a randomly chosen pregnant woman giving birth to a Down's Syndrome child is r…
- 4In an experiment, the time taken, minutes, for a 1-kg block of ice to melt completely under 7 pre-determined tempera…
- 5An electrical appliance supplier is investigating the potential impact of monthly advertisement expenditure, denoted as…