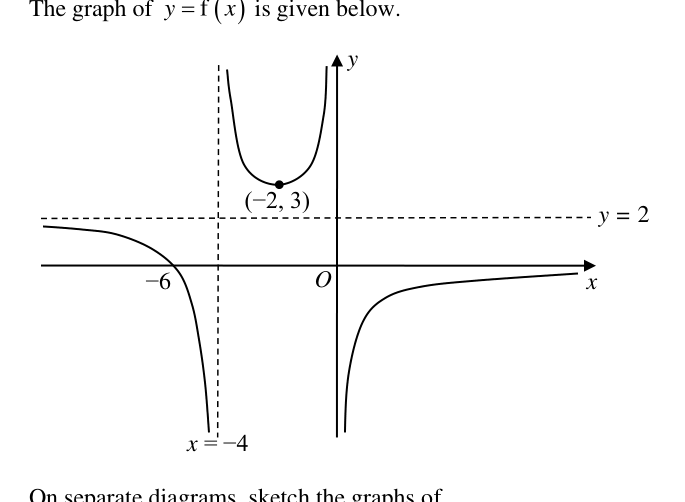
The graph of is given below. On separate diagrams, sketch the graphs of
- (i)
- (8)
- (a)
- (ii)
- (ii)
- (b)
A curve has parametric equations
, .
Describe a sequence of transformations to obtain the curve
,
from .
- (a)
It won't just hand you the answer — it asks where you're stuck.How the checker works
Worked solution
8 (a)(i)
1. Convert the asymptotes of f into features of 1/f
The vertical asymptotes of at and become points where (the curve approaches the -axis there).
The horizontal asymptote (as ) becomes .
The horizontal asymptote (as ): since , .
2. Convert the zeros of f into vertical asymptotes of 1/f and map the turning point
crosses the -axis once on the left branch (some ) and once on the right branch (some ). At each zero , so these become vertical asymptotes of .
The minimum point of maps to a maximum point of (turning points keep their -coordinate; , maxmin).
3. Use sign preservation to draw the three correctly-shaped branches
Since has the same sign as :
- Left branch (): from at , rising to at the left zero, then from rising up to as .
- Middle branch (): with the new maximum ; the curve as and as (a positive hump).
- Right branch (): from near , falling to at the right zero, then from down and back up to as .
Label , the maximum , and the new vertical asymptotes.
Sketch with: horizontal asymptote as ; maximum point on the middle branch; the curve as and as (since has vertical asymptotes there); new vertical asymptotes at the two points where (one for , one for ); and as (since ). The graph stays positive wherever and negative wherever .
8 (a)(8)(a)(ii)
1. Set up the rules linking $f'$ to $f$ and carry over the asymptotes.
The graph of records the gradient of :
- where is increasing, ;
- where is decreasing, ;
- at a stationary point of , (an -intercept of ).
The vertical asymptotes of at and remain vertical asymptotes of . Where levels off towards a horizontal asymptote, the gradient , so .
2. Determine the sign and limiting behaviour of $f'$ on each interval.
: falls from (as ) down to at , so is decreasing . As the curve flattens to , so ; near the fall is steep, so .
: decreases towards the minimum at , so , reaching at .
: increases away from the minimum towards the asymptote , so , and as .
: rises from (near ) and levels off towards , so throughout, with near and as .
3. Sketch the graph of $y=f'(x)$.
Draw vertical asymptotes at and and the horizontal asymptote . Then:
- left branch (): entirely below the -axis, coming up to as and plunging to at ;
- middle branch (): below the axis on , crossing the -axis at , then above the axis rising to at ;
- right branch (): above the axis, descending from near to as .
Label the -intercept and all asymptotes.
A curve with vertical asymptotes at and and horizontal asymptote . For : , rising from (near ) to as . For : . The curve cuts the -axis at (where has its minimum), then for : , rising to near . For : , falling from (near ) to as .
8 (a)(8)(b)
1. Find the Cartesian equations for both curve $C$ and the new curve.
For curve :
,
Substituting into the second equation, we obtain the Cartesian equation for :
For the new curve:
Substituting into , we obtain:
2. Express the Cartesian equation of the new curve in terms of the function defining curve $C$.
Let . We want to express in terms of .
Rewrite the new equation to reveal the structure of :
Since , we have:
3. Describe the sequence of transformations based on the relationship $y = \frac{1}{8} f(x-1)$.
The transformation from to consists of two standard operations:
- The term represents a horizontal translation of unit in the positive -direction.
- The multiplier outside the function represents a vertical scaling parallel to the -axis by a scale factor of .
- A translation of unit in the positive -direction.
- A scaling parallel to the -axis by a scale factor of .
(Note: These transformations can be performed in either order.)
AI analysis — may contain mistakes.
Worked this one out on paper? Snap your steps and Gigle's AI math checker will circle the step where it went wrong.
More questions on this topic
- 15 (a) Solve the following integral. …
- 2Sketch, on the same diagram, the graphs of and . (You are not required to label any a…
- 3The diagram shows the graphs of and . The graph of has t…
- 4The graph of has a maximum turning point at and passes through the origin. The lines …
- 5On a single diagram, sketch the graphs of and where the following conditions are satisfied, indi…