The diagram shows the graphs of and . The graph of has turning points at and , crosses the x-axis at and , and the equations of asymptotes are , and . The graph of crosses the x-axis at , and the equations of asymptotes are and . On separate diagrams, sketch the graphs of the following, labelling clearly the equation(s) of any asymptote(s), coordinates of any axial intercept(s) and turning point(s) where applicable.
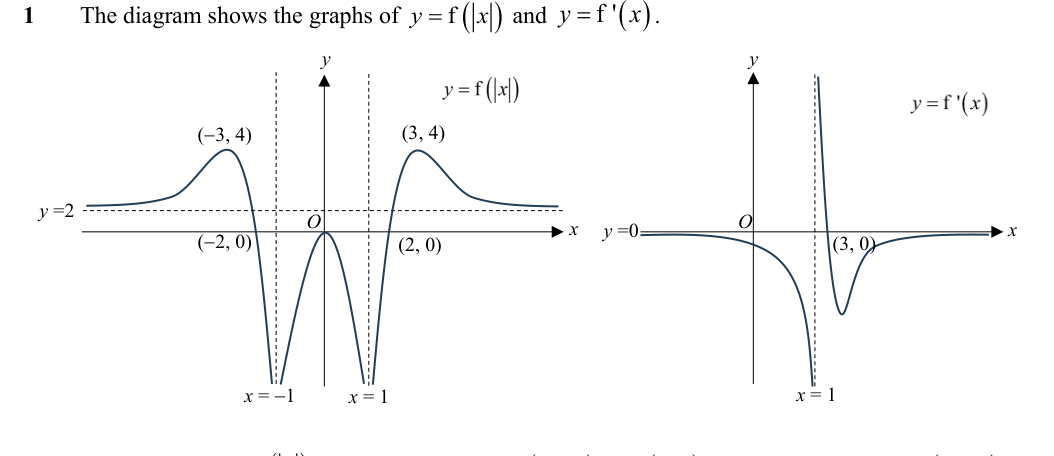
- (a)
- (b)
- (c)
It won't just hand you the answer — it asks where you're stuck.How the checker works
Worked solution
1(a)
1. Deduce the graph of $y = f(x)$ for $x \ge 0$ from $y = f(|x|)$.
For , the transformation simplifies to . Thus, the right portion of the graph of is identical to the right portion of the given graph.
From the given information, we deduce the following features for :
- Vertical asymptote:
- Horizontal asymptote: (as )
- Axial intercept:
- Turning point: Local maximum at
To connect the intercept at up to the peak at , the graph must approach as .
2. Deduce the graph of $y = f(x)$ for $x < 1$ using $y = f'(x)$.
The vertical asymptote on is merely a reflection; itself only has a vertical asymptote at .
From the description of , its only -intercept is at . This means has no turning points for .
Since has an asymptote at , approaches a horizontal asymptote as , which must be (consistent with ).
Because approaches and has no turning points for , it is strictly monotonic. Given that typical rational functions with a single vertical asymptote and a horizontal asymptote have an even-multiplicity pole (to go to the same infinity on both sides and avoid slant asymptotes), as .
Consequently, monotonically decreases from down to , crossing the negative -axis and negative -axis.
3. Sketch the complete graph of $y = f(x)$.
Combine the deduced features to sketch the full graph of :
- Draw and label the asymptotes and with dashed lines.
- Plot and label the known coordinates: the -intercept at and the turning point at .
- Sketch the right branch () coming from at , passing through , turning smoothly at , and approaching from above.
- Sketch the left branch () as a strictly decreasing curve starting from just below at the far left, crossing the negative axes, and going down to at .
Sketch of :
- Axes & Asymptotes: Draw - and -axes. Draw dashed lines for the vertical asymptote and the horizontal asymptote , labelling them with their equations.
- For : The curve comes up from (near ), crosses the -axis at , reaches a local maximum at , and then curves downwards to approach from above as .
- For : The curve starts just below on the far left (), strictly decreases to cross the negative -axis and negative -axis, and approaches as .
(Clearly label the asymptote equations , and the key coordinates and .)
1(b)
1. Identify the axial intercepts of the reciprocal graph.
The graph of has a vertical asymptote at , meaning as . Consequently, its reciprocal .
This provides an x-intercept for the reciprocal graph at the point .
2. Identify the vertical and horizontal asymptotes.
The graph of crosses the x-axis at , so . The reciprocal will therefore have a vertical asymptote at .
Furthermore, since has a horizontal asymptote of (meaning as ), the reciprocal as . Thus, the reciprocal graph has no horizontal asymptotes.
3. Determine the shape of the curve and any unmarked turning points.
- For : is positive and decreases from to . Thus, increases from (at ) to (as ).
- For : crosses into negative values but must approach as . By Rolle's Theorem/logic, it must reach a negative local minimum before turning back towards . Consequently, starts from at , goes up to reach a negative local maximum, and then decreases back to as .
- For : does not cross the x-axis and approaches as . Thus connects from and monotonically tends towards as .
A valid sketch must include:
- x-intercept at .
- Vertical asymptote at .
- No horizontal asymptotes.
- Curve shape:
- For , the curve starts from and goes to as .
- For , the curve comes from at , reaches a negative local maximum (coordinates not required), and then goes down to as .
- For , the curve emerges from and goes to as (following the original visual sign of ).
1(c)
1. Determine the sequence of transformations required.
Let . The target function is .
This requires two transformations applied to the graph of :
- Replace with : a horizontal translation of unit in the positive -direction.
- Multiply the function by : a reflection about the -axis.
2. Apply the transformations to the turning points and $x$-intercepts.
Turning points:
Start: and
Translate right by 1: and
Reflect in -axis: and
-axis intercepts:
Start: and
Translate right by 1: and
Reflect in -axis: The -coordinates are , so they remain at and .
3. Apply the transformations to the asymptotes.
Vertical Asymptotes:
Start: and
Translate right by 1: and
Reflect in -axis: Vertical lines are unchanged, remaining and .
Horizontal Asymptote:
Start:
Translate right by 1: Unchanged,
Reflect in -axis:
Sketch a graph with the following labelled features:
- Turning points (minima): and
- -axis intercepts: and
- Vertical asymptotes: (the -axis) and
- Horizontal asymptote:
AI analysis — may contain mistakes.
Worked this one out on paper? Snap your steps and Gigle's AI math checker will circle the step where it went wrong.
More questions on this topic
- 15 (a) Solve the following integral. …
- 2Sketch, on the same diagram, the graphs of and . (You are not required to label any a…
- 3The diagram shows the graphs of and . The graph of has t…
- 4The graph of has a maximum turning point at and passes through the origin. The lines …
- 5On a single diagram, sketch the graphs of and where the following conditions are satisfied, indi…