Mr Dough's factory produces packets of flour for sale in local supermarkets packed in 2 sizes -- Regular-sized packets and Large-sized packets. Automated machines weigh and pack the flour. A recent major power outage resulted in all his machines being needed to be recalibrated upon restarting. Regular-sized packets are supposed to have a mean mass of 1 kg. Mr Dough suspects that his machines now pack Regular-sized packets that are underweight. He took a sample of his Regular-sized packets and measured their masses, g (correct to nearest 5 g). The results are recorded as follows: (see table below) Large-sized packets of flour are known to have a normal distribution with a mean mass of 2 kg. Mr Dough also suspects that his machines are now not packing the Large-sized packets according to the required mass correctly. A sample of 15 Large-sized packets of flour gave a total mass of 30075 g. Assuming Large-sized packets of flour have a population variance of , an appropriate test was carried out which gave a p-value of 0.0529.
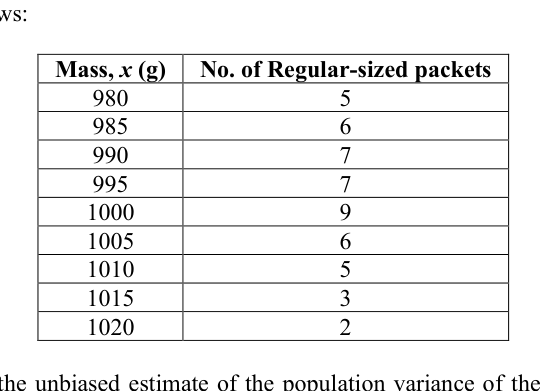
- (a)
Determine the unbiased estimate of the population variance of the mass of Regular-sized packets.
- (b)
Explain whether Mr Dough should conduct a one-tail or a two-tail test.
- (c)
Carry out the test at 5% level of significance and give your conclusion in context. Explain whether it is necessary to assume that the mass of Regular-sized packets of flour follow a normal distribution.
- (d)
Showing all necessary workings, prove that correct to 3 significant figures.
- (e)
Using , find the possible range of values of , giving your answer to the nearest gram.
It won't just hand you the answer — it asks where you're stuck.How the checker works
Worked solution
11(a)
1. Determine the unbiased estimate of the population variance directly from the grouped data using a graphing calculator.
Entering the data into a graphing calculator (with masses as and number of packets as frequency):
(to 3 s.f.)
11(b)
1. Identify the direction of the test from the context and conclude.
Since Mr Dough suspects that the Regular-sized packets are underweight, he is testing for a decrease in the mean mass (i.e. the alternative hypothesis is ). Therefore, a one-tail test should be conducted.
He should conduct a one-tail test because he suspects the packets are underweight, meaning he is only testing if the population mean mass is less than 1 kg.
11(c)
1. Formulate the null and alternative hypotheses.
Let be the mass of a Regular-sized packet in grams, and be the population mean mass.
(Note: A one-tailed test is used because the suspicion is that the packets are 'underweight'.)
2. Calculate the test statistic and $p$-value from the sample data.
From the data provided (and calculations typical for part a):
g
Under , the test statistic is
Using a graphing calculator for a -test:
(to 3 s.f.)
3. Make a decision and interpret the result in the context of the problem.
Since the -value , we reject .
There is sufficient evidence at the 5% level of significance to conclude that the population mean mass of Regular-sized packets is less than 1 kg, hence Mr Dough's suspicion that his machines are packing underweight packets is justified.
4. Explain whether the assumption of a normal distribution is necessary.
It is not necessary to assume that the mass of the packets follows a normal distribution.
Since the sample size is sufficiently large (), by the Central Limit Theorem, the sample mean is approximately normally distributed.
Since , reject . There is sufficient evidence at the 5% level of significance to conclude that the Regular-sized packets are underweight.
It is not necessary to assume a normal distribution. Since , by the Central Limit Theorem, the sample mean is approximately normally distributed.
11(d)
1. Calculate the sample mean and formulate the hypotheses to determine the type of test.
Let be the mass of a Large-sized packet.
Sample mean,
Population mean, (2 kg)
The test is two-tailed since Mr Dough suspects the mass is not packed 'correctly' (rather than purely 'underweight' or 'overweight').
2. Use the given p-value for a two-tailed test to find the corresponding z-value.
For a two-tailed test, the -value is .
Using the standard normal distribution:
3. Equate the z-value to the standard normal test statistic formula to solve for the population standard deviation, $\sigma$.
The test statistic for the sample mean is given by .
(shown)
AI analysis — may contain mistakes.
Worked this one out on paper? Snap your steps and Gigle's AI math checker will circle the step where it went wrong.
More questions on this topic
- 1A nutritionist claims that the mean number of calories in an energy bar is 350 cal. The nutritionist collected and measu…
- 2The owner of Eng Choo Farm claims that the eggs produced at his farm has an average cholesterol content of mg pe…
- 3A bakery claims that the mass of a cake, on average, is 600 grams each. A random sample of 10 cakes is examined and the…
- 4An electrical appliance supplier is investigating the potential impact of monthly advertisement expenditure, denoted as…
- 5Researchers at University S claimed that Fungus A, a strain of fungi that is typically found in soil and plants, was a…