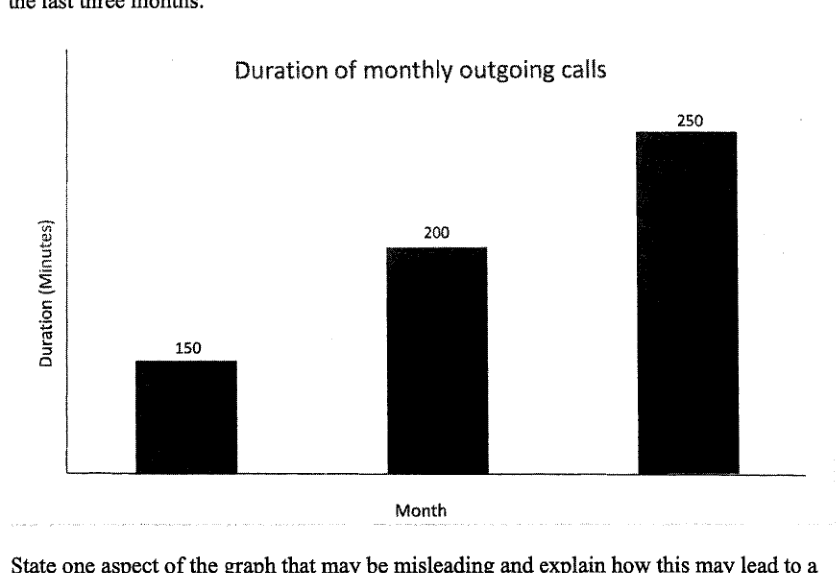
彼得绘制了这张图表,以显示他过去三个月每月拨出电话的时长(以分钟为单位)。 指出该图表中可能具有误导性的一个方面,并解释这可能如何导致对图表的误读。
它不会直接告诉你答案,而是问你卡在哪一步看看 AI 是怎么陪你一步步弄懂这道题的
完整解法
16
1. State one misleading aspect of the graph
The vertical axis has no tick marks or numerical scale shown.
2. Explain how this could cause misinterpretation
Without a scale, the reader cannot accurately compare the bar heights. The increase from to to minutes may therefore appear exaggerated or understated.
答案
One misleading aspect is that the vertical axis has no scale markings. This makes it difficult to judge the actual heights of the bars, so a reader may wrongly think the increase in call duration from month to month is larger or smaller than it really is.
AI 分析,可能出错
用 AI 批改,圈出写错的那一步,并自动将你的薄弱点存入错题本,形成你的错因库。
同一知识点的其他题
- 1解释上面的折线图可能如何产生误导。 答案 ...
- 2下面是来自《2023年新加坡年度气候报告》的一张图表,显示了自1929年以来新加坡最热的10个年份。 指出该图表中可能具有误导性的一个方面,并解释这如何可能导致对图表的误读。 ...
- 3某网站展示了一幅关于非洲象偷猎统计数据的海报。 解释上述海报可能具有误导性的原因。
- 4该图表显示了 2017 年至 2019 年年度自行车马拉松赛中的骑行人数。 指出该图表中可能具有误导性的一个方面。 解释这可能会如何导致对图表的误解。
- 5一家公司在这张图表中展示了他们 2023 年的财务报告。 指出图表中可能产生误导的一个方面,并解释这可能会如何导致误解。 答案 ...