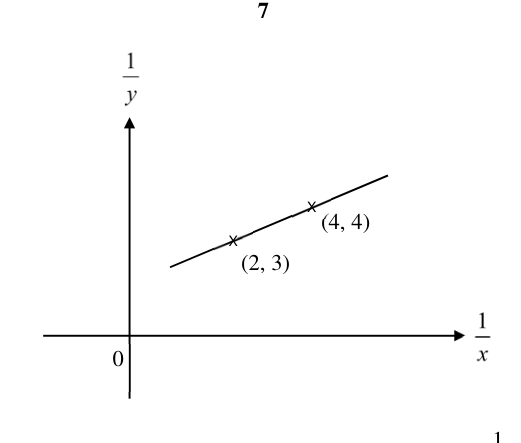
The diagram shows part of a straight line graph obtained by plotting against . Express in terms of .
It won't just hand you the answer — it asks where you're stuck.How the checker works
Worked solution
6
1. Calculate the gradient of the straight line.
Let and .
Gradient
2. Find the equation of the straight line in terms of $X$ and $Y$.
3. Substitute the original variables back into the equation.
4. Rearrange to express $y$ in terms of $x$.
Answer
AI analysis — may contain mistakes.
Worked this one out on paper? Snap your steps and Gigle's AI math checker will circle the step where it went wrong.
More questions on this topic
- 1The mass, m mg, of a radioactive substance decreases with time, t hours. Measured values of m and t are given in the tab…
- 2A drug is administered to a patient through an injection. The concentration of drug, mg/ in a patient's bloodstre…
- 3The table shows experimental values of two variables, and . | | 2 | 4 | 6 | 8 | |---|---|---|---|---| | |…
- 4Measured values of and are given in the following table. | | 1.2 | 1.6 | 2.0 | 2.6 | 3.5 | 4.5 | |---|---|--…
- 5The table shows experimental values of and . | | 2 | 3 | 4 | 5 | 6 | |---|---|---|---|---|---| | | 11.8 |…