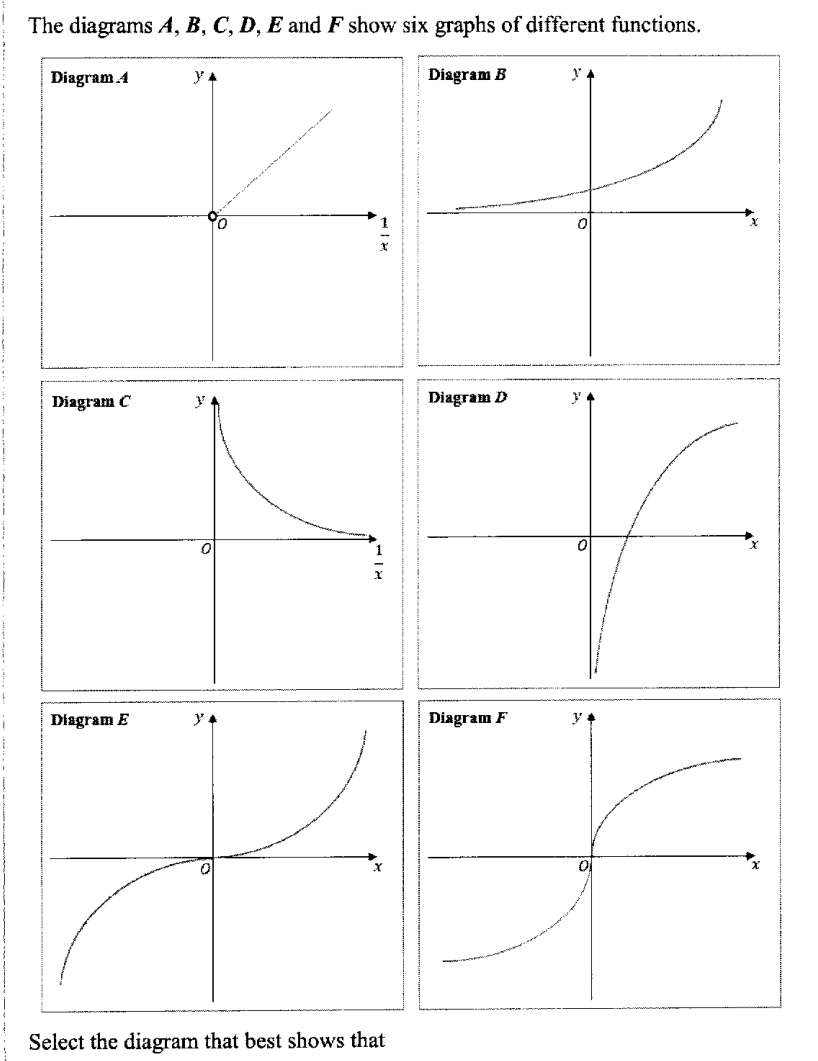
The diagrams , , , , and show six graphs of different functions. Select the diagram that best shows that
- (a)
is inversely proportional to ,
Diagram ...
- (b)
, where is an odd integer greater than 1,
Diagram ...
- (c)
, where is an integer greater than 1.
Diagram ...
It won't just hand you the answer — it asks where you're stuck.How the checker works
Worked solution
6(a)
1. Express the inverse proportion relationship as a linear equation
If is inversely proportional to , then for some constant .
This can be rewritten in linear form as .
2. Identify the corresponding graph
Plotting against yields a straight line passing through the origin with gradient . Diagram A shows a straight line graph of against starting from the origin.
A
6(b)
1. Identify the key features of the graph of $y = x^n$ for an odd integer $n > 1$
For where is an odd integer greater than 1 (e.g., ):
- The graph passes through the origin .
- It is an odd function, meaning it has rotational symmetry about the origin (it lies in the first and third quadrants).
- The gradient is at , meaning the curve has a horizontal tangent at the origin.
- As increases, the gradient increases, making the curve steeper.
2. Select the matching diagram
Diagram E shows a curve passing through the origin, lying in the first and third quadrants, and flattening out (horizontal tangent) at the origin before becoming steeper. This matches the properties of for odd . (Diagram F has a vertical tangent at the origin, which corresponds to ).
E
6(c)
1. Identify the characteristics of the graph of $y = n^x$ for $n > 1$
The function where represents exponential growth. The graph must lie entirely above the -axis (), pass through , and increase rapidly as increases.
2. Match the characteristics to the given diagrams
Diagram B shows a curve that is entirely above the -axis, has a positive -intercept, and increases exponentially from left to right. This matches the properties of .
B
AI analysis — may contain mistakes.
Worked this one out on paper? Snap your steps and Gigle's AI math checker will circle the step where it went wrong.
More questions on this topic
- 1The mass, m mg, of a radioactive substance decreases with time, t hours. Measured values of m and t are given in the tab…
- 2A drug is administered to a patient through an injection. The concentration of drug, mg/ in a patient's bloodstre…
- 3The table shows experimental values of two variables, and . | | 2 | 4 | 6 | 8 | |---|---|---|---|---| | |…
- 4Measured values of and are given in the following table. | | 1.2 | 1.6 | 2.0 | 2.6 | 3.5 | 4.5 | |---|---|--…
- 5The table shows experimental values of and . | | 2 | 3 | 4 | 5 | 6 | |---|---|---|---|---|---| | | 11.8 |…