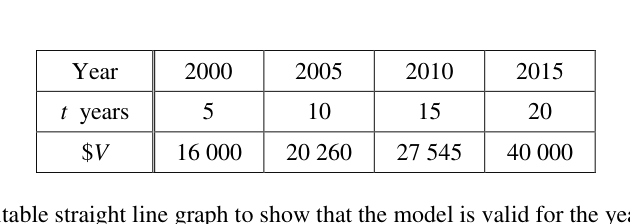
An auction house claimed that it is worthwhile to invest in their art pieces as the value of one of their art pieces has been increasing exponentially since it was produced. The value, , of this art piece is related to , the number of years since it was produced at the start of the year 1995. The variables and can be modelled by the equation , where and are constants. The table below gives values of and at the start of some of the years 2000 to 2015.
- (i)
Plot a suitable straight line graph to show that the model is valid for the years 2000 to 2015.
- (ii)
Estimate the value of and of .
- (iii)
A claim was made that in the year 2065, this art piece will increase in value by 500 times from the time it was produced. Do you agree? Justify your answer.
It won't just hand you the answer — it asks where you're stuck.How the checker works
Worked solution
8(i)
1. Transform the given non-linear equation into a linear form $Y = mX + c$.
Taking the natural logarithm on both sides:
This is in the linear form , where , , gradient , and -intercept .
2. Calculate the values of $Y = \ln(V - 10\;000)$ for each given $t$.
For , :
For , :
For , :
For , :
| 5 | 10 | 15 | 20 | |
|---|---|---|---|---|
| 8.70 | 9.24 | 9.77 | 10.31 |
3. Plot the points and draw the line of best fit to verify the model.
Plot the points , , , and on a Cartesian plane with on the horizontal axis and on the vertical axis.
Draw a straight line passing through these points.
Since the plotted points lie on a straight line, the linear relationship is verified, which shows that the original model is valid for the years 2000 to 2015.
A straight line graph of against is plotted, showing that the points lie on a straight line, thus validating the model.
8(ii)
1. Express the given equation in linear form
2. Calculate the gradient to estimate $k$
From the table, the points are approximately:
, , ,
Gradient
(Note: Using a line of best fit from part (i), a typical value for is around . Let's re-evaluate using the first and last points exactly: )
3. Calculate the vertical intercept to estimate $a$
The vertical intercept is .
Using point and :
(Alternatively, using exact values: )
(to 3 s.f.)
,
8(iii)
1. Determine the values of a and k from the previous part
From part (ii), the linearised equation is . Using the points and :
So .
2. Calculate the initial value of the art piece (at t = 0)
At (year 1995),
3. Calculate the value of the art piece in the year 2065
In the year 2065, .
4. Compare the increase to the claim and conclude
Ratio
Since , the claim is incorrect. (Note: Using exact values and , and . Ratio ).
No, I do not agree. The value in 2065 is approximately 16.3 times the initial value, which is not 500 times.
AI analysis — may contain mistakes.
Worked this one out on paper? Snap your steps and Gigle's AI math checker will circle the step where it went wrong.
More questions on this topic
- 1The mass, m mg, of a radioactive substance decreases with time, t hours. Measured values of m and t are given in the tab…
- 2A drug is administered to a patient through an injection. The concentration of drug, mg/ in a patient's bloodstre…
- 3The table shows experimental values of two variables, and . | | 2 | 4 | 6 | 8 | |---|---|---|---|---| | |…
- 4Measured values of and are given in the following table. | | 1.2 | 1.6 | 2.0 | 2.6 | 3.5 | 4.5 | |---|---|--…
- 5The table shows experimental values of and . | | 2 | 3 | 4 | 5 | 6 | |---|---|---|---|---|---| | | 11.8 |…