The table below shows the number of books read by 50 students in Class A in semester 1.
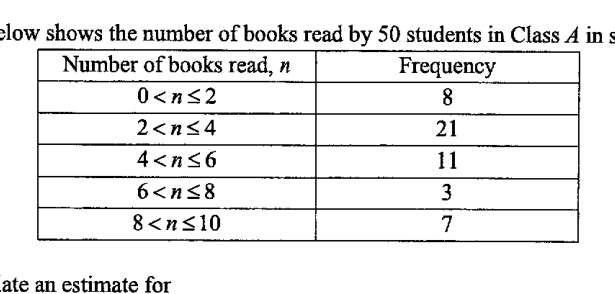
- (a)
Calculate an estimate for
- (i)
the mean number of books read by the students,
Answer ...
- (ii)
the standard deviation of the number of books read by the students.
Answer ...
- (i)
- (b)
After introducing a reading programme in semester 2, the number of books read by each student in Class A increased by 2.
State how the mean and standard deviation will change after the increase.Answer
...
- (c)
The standard deviation of the number of books read by the students from Class B was 3.15.
Use this information to comment on one difference between the two distributions.
Answer
...
It won't just hand you the answer — it asks where you're stuck.How the checker works
Worked solution
23(a)(i)
1. Find the estimated mean using class midpoints and frequencies.
Class midpoints:
books
23(a)(ii)
1. Calculate the estimated standard deviation using class midpoints and frequencies.
Class midpoints are and from part (a)(i), .
books
23(b)
1. State the effect on the mean when every value is increased by 2.
Since each student reads more books, every data value is increased by .
So the mean also increases by :
2. State the effect on the standard deviation when every value is increased by 2.
Adding the same number to every data value shifts the whole distribution but does not change its spread.
So the standard deviation remains unchanged:
The mean increases by , from to books.
The standard deviation remains unchanged at books.
23(c)
1. Compare the standard deviations and interpret the difference in spread.
Class A standard deviation books.
Class B standard deviation books.
Since , Class B has a greater spread in the number of books read. Hence, Class B's data is less consistent than Class A's.
Since Class B has a larger standard deviation, , the number of books read by students in Class B is more spread out than in Class A.
AI analysis — may contain mistakes.
Worked this one out on paper? Snap your steps and Gigle's AI math checker will circle the step where it went wrong.
More questions on this topic
- 1Mr. Garcia asked the members of his health class how many days last week they exercised for at least 30 minutes. The res…
- 2A survey was carried out to find out the number of emails received in a week by each of a group of students. The table b…
- 3The cumulative frequency curve shows the marks obtained by the 120 students in a recent Mathematics Test. The maximum ma…
- 4The waiting time, t in minutes, for 40 customers at two phone service shops, Shop A and Shop B, are as follows. Calculat…
- 5John conducted a survey on the average time spent reading per week. This survey was carried out outside Woodlands Region…