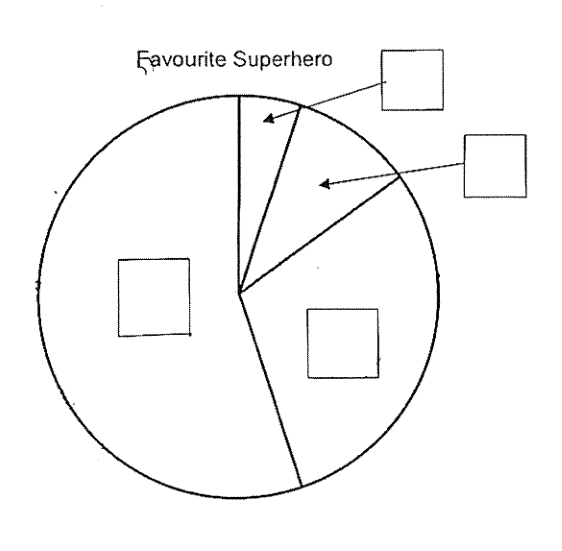
The pie chart shows the results of a survey on the favourite superhero of some pupils. One of the numbers in the table is covered by an ink blot.
Superhero No. of pupils Category Wonder Woman More than half A Ironman 30% B Thor [ink blot] C Superman 10% D
Fill in the boxes in the pie chart with A, B, C, and D to represent the given data in the table.
| Superhero | No. of pupils | Category |
|---|---|---|
| Wonder Woman | More than half | A |
| Ironman | 30% | B |
| Thor | [ink blot] | C |
| Superman | 10% | D |
It won't just hand you the answer — it asks where you're stuck.How the checker works
Worked solution
2
1. Identify the largest sector (Category A)
Wonder Woman (Category A) is 'More than half', which means . The largest sector in the pie chart is clearly more than half the circle. So, the largest sector is A.
2. Determine the percentage for Thor (Category C)
The total percentage must be . Since A is , B is , and D is , the sum of A, B, and D is . Therefore, C must be .
3. Assign the remaining categories to the sectors based on their sizes
We have B (), D (), and C (). Comparing their sizes:
So, B is the largest of the remaining three, D is the next, and C is the smallest.
Matching to the pie chart:
- Medium sector (bottom right) = B
- Second smallest sector (top right) = D
- Smallest sector (top, next to vertical line) = C
Largest sector: A
Medium sector: B
Smallest sector: C
Second smallest sector: D
AI analysis — may contain mistakes.
Worked this one out on paper? Snap your steps and Gigle's AI math checker will circle the step where it went wrong.
More questions on this topic
- 1一根绳子长米,也就是米. ___ 判断对错
- 2Hamid borrowed a sum of money for 3 years at an interest rate of 3.5% per annum simple interest to pay for his car. If t…
- 3| Carton | Number of toys | Percentage of toys which are defective | | :--- | :---: | :---: | | A | 200 | 3% | | B | 300…
- 4某商场进行促销活动,对一些商品打折出售,妈妈在商场花了 240 元买了一件衣服,比原价便宜了 60 元。这件衣服是打( )折出售的。 A. 二五 B. 四 C. 五 D. 八
- 5: