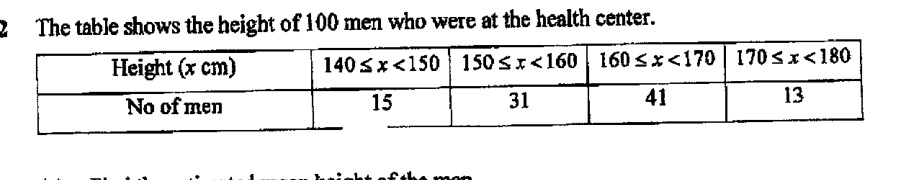
The table shows the height of 100 men who were at the health center.
- (a)
Find the estimated mean height of the men.
Answer ___ cm
- (b)
Find the standard deviation of the height of the men.
Answer ___ cm
It won't just hand you the answer — it asks where you're stuck.How the checker works
Worked solution
22(a)
1. Use class midpoints and calculate the estimated mean
Midpoints:
Answer
22(b)
1. Use the midpoints to calculate $\sum fx^2$
Class midpoints are .
2. Substitute into the grouped-data standard deviation formula
Using from part (a) and ,
Answer
AI analysis — may contain mistakes.
Worked this one out on paper? Snap your steps and Gigle's AI math checker will circle the step where it went wrong.
More questions on this topic
- 1Mr. Garcia asked the members of his health class how many days last week they exercised for at least 30 minutes. The res…
- 2A survey was carried out to find out the number of emails received in a week by each of a group of students. The table b…
- 3The cumulative frequency curve shows the marks obtained by the 120 students in a recent Mathematics Test. The maximum ma…
- 4The waiting time, t in minutes, for 40 customers at two phone service shops, Shop A and Shop B, are as follows. Calculat…
- 5John conducted a survey on the average time spent reading per week. This survey was carried out outside Woodlands Region…