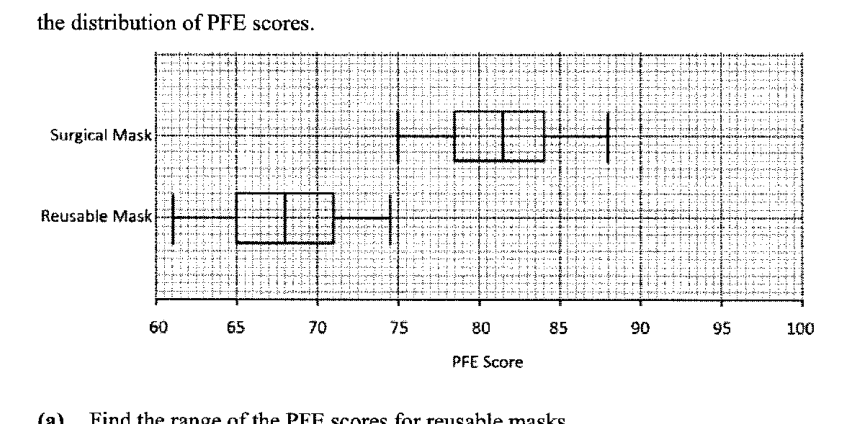
A researcher conducted a Particle Filtration Efficiency (PFE) test on surgical masks and reusable masks which have been used for 24 hours. The box-and-whisker plots represent the distribution of PFE scores.
- (a)
Find the range of the PFE scores for reusable masks.
Answer ...
- (b)
Find the interquartile range of the PFE scores for surgical masks.
Answer ...
- (c)
Make two comparisons between the PFE scores for surgical masks and reusable masks.
1 ...
...
2 ...
...
It won't just hand you the answer — it asks where you're stuck.How the checker works
Worked solution
14(a)
1. Identify the maximum and minimum values for reusable masks from the box-and-whisker plot
2. Calculate the range
14(b)
1. Identify the upper and lower quartiles for surgical masks from the box plot
2. Calculate the interquartile range
14(c)
1. Compare the medians to make a statement about the average/general performance
Median for surgical masks =
Median for reusable masks =
Since , surgical masks generally have higher PFE scores.
2. Compare the interquartile ranges (or ranges) to make a statement about the spread/consistency
IQR for surgical masks =
IQR for reusable masks =
Since , the PFE scores for surgical masks are more consistent.
- The median PFE score for surgical masks is higher than that for reusable masks, indicating that surgical masks generally have higher PFE scores.
- The interquartile range of PFE scores for surgical masks is smaller than that for reusable masks, indicating that the PFE scores for surgical masks are more consistent.
AI analysis — may contain mistakes.
Worked this one out on paper? Snap your steps and Gigle's AI math checker will circle the step where it went wrong.
More questions on this topic
- 1The mass, m mg, of a radioactive substance decreases with time, t hours. Measured values of m and t are given in the tab…
- 2A drug is administered to a patient through an injection. The concentration of drug, mg/ in a patient's bloodstre…
- 3The table shows experimental values of two variables, and . | | 2 | 4 | 6 | 8 | |---|---|---|---|---| | |…
- 4Measured values of and are given in the following table. | | 1.2 | 1.6 | 2.0 | 2.6 | 3.5 | 4.5 | |---|---|--…
- 5The table shows experimental values of and . | | 2 | 3 | 4 | 5 | 6 | |---|---|---|---|---|---| | | 11.8 |…