The variables x and y are known to be related by the formula where p and q are constants.
- (a)
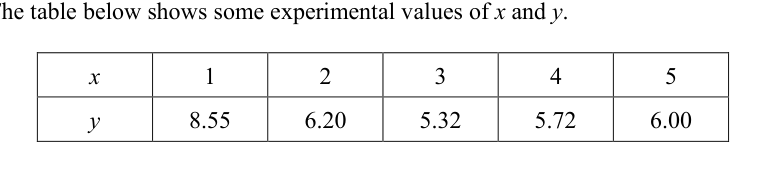
The table below shows some experimental values of x and y.
- (i)
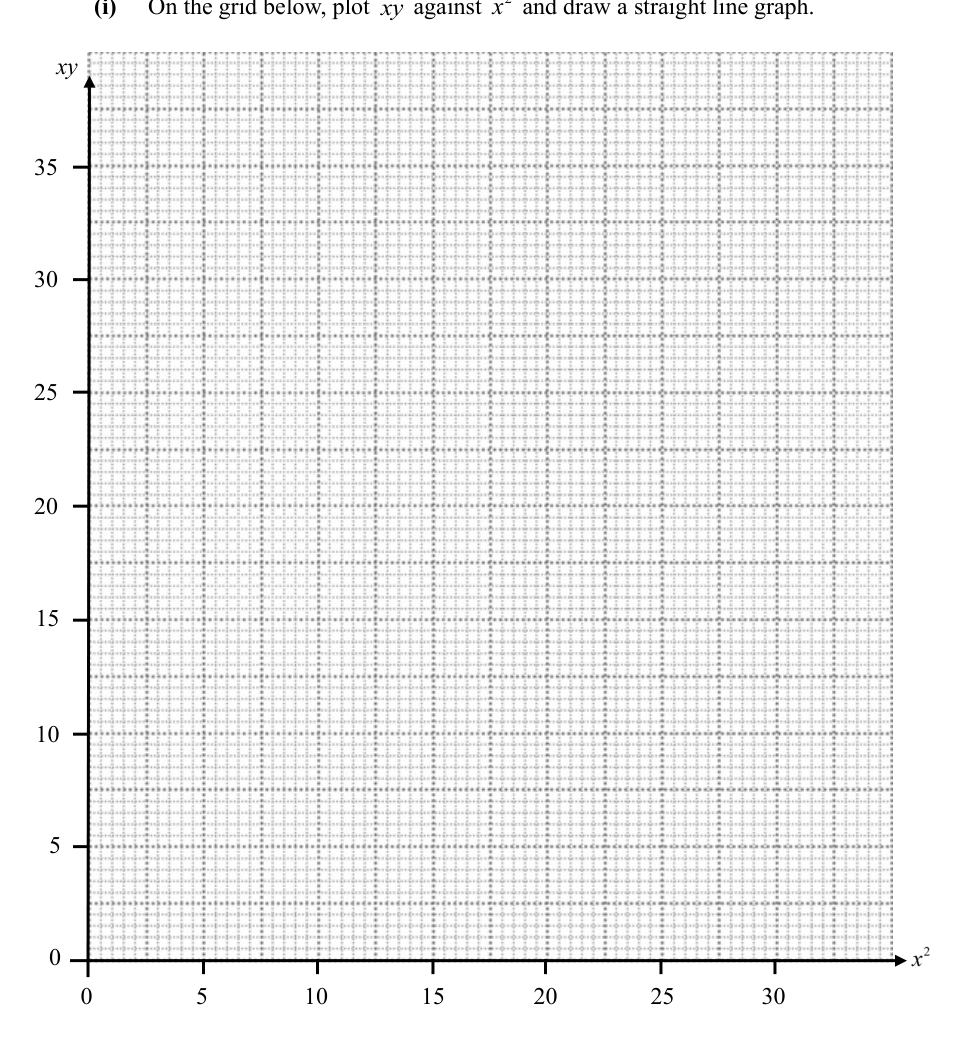
On the grid below, plot against and draw a straight line graph.
On the grid below, plot against and draw a straight line graph.
- (ii)
Use your graph to estimate
- (a)
the value of and of .
- (b)
the positive value of that satisfies the equation .
- (a)
- (i)
- (b)
Explain how another straight line graph can be obtained from by plotting against , expressing clearly the gradient and vertical intercept in terms of p and/or q. You need not draw this straight line graph.
It won't just hand you the answer — it asks where you're stuck.How the checker works
Worked solution
6(a)(i)
1. Calculate the values of $X = x^2$ and $Y = xy$ for each pair of $(x, y)$.
For :
For :
For :
For :
For :
2. Plot the points and draw the line of best fit.
Plot the points , , , , and on the grid with on the horizontal axis and on the vertical axis. Draw a straight line of best fit passing as close as possible to all plotted points.
Points to plot: , , , , . A straight line of best fit should be drawn through these points.
6(a)(ii)(a)
1. Convert the given non-linear equation into a linear form $Y = mX + c$.
Given .
Multiply throughout by :
This is in the form , where , , gradient , and vertical intercept .
2. Determine the value of $p$ by finding the gradient of the line of best fit.
Using two points on the line of best fit, for example and (values may vary slightly based on the drawn line):
3. Determine the value of $q$ by finding the vertical intercept of the line of best fit.
From the graph, the line intersects the -axis (where ) at approximately .
,
6(a)(ii)(b)
1. Relate the given equation to the variables plotted on the graph
The given equation is .
Since , this is equivalent to .
Multiplying by gives .
2. Use the graph to find the value of $x^2$ when $xy = 20$ and solve for $x$
On the graph of against , locate on the vertical axis.
Read the corresponding value on the horizontal axis ().
From the line of best fit, when , .
(taking the positive root).
6(b)
1. Rearrange the given equation to isolate $x$ terms on one side to prepare for division
2. Divide by $xy$ to obtain the required variables $\frac{x}{y}$ and $\frac{1}{xy}$
Divide by :
3. Identify the gradient and vertical intercept
Comparing with where and :
Gradient
Vertical intercept
Divide the equation by to get . The gradient is and the vertical intercept is .
AI analysis — may contain mistakes.
Worked this one out on paper? Snap your steps and Gigle's AI math checker will circle the step where it went wrong.
More questions on this topic
- 1The mass, m mg, of a radioactive substance decreases with time, t hours. Measured values of m and t are given in the tab…
- 2A drug is administered to a patient through an injection. The concentration of drug, mg/ in a patient's bloodstre…
- 3The table shows experimental values of two variables, and . | | 2 | 4 | 6 | 8 | |---|---|---|---|---| | |…
- 4Measured values of and are given in the following table. | | 1.2 | 1.6 | 2.0 | 2.6 | 3.5 | 4.5 | |---|---|--…
- 5The table shows experimental values of and . | | 2 | 3 | 4 | 5 | 6 | |---|---|---|---|---|---| | | 11.8 |…