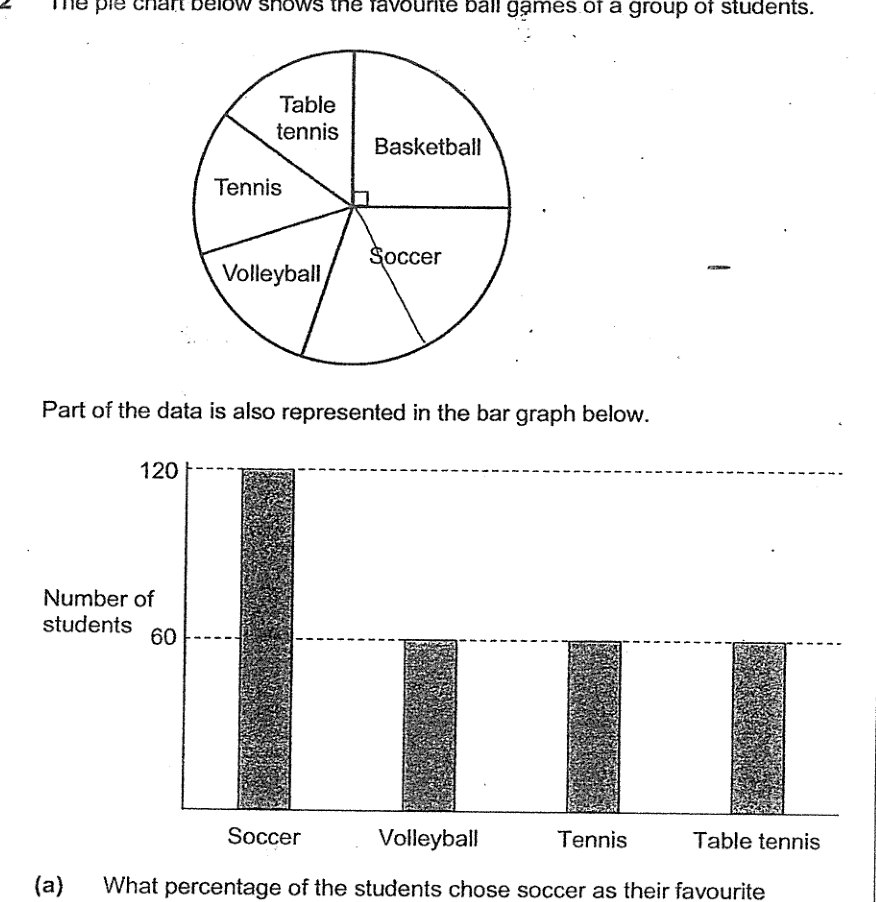
The pie chart below shows the favourite ball games of a group of students. Part of the data is also represented in the bar graph below.
- (a)
What percentage of the students chose soccer as their favourite ball game?
- (b)
How many students were there in the group?
It won't just hand you the answer — it asks where you're stuck.How the checker works
Worked solution
12(a)
1. Identify the angle representing soccer and convert it to a percentage
The angle for soccer is a right angle, which is .
12(b)
1. Read the number of students who chose soccer from the bar graph
From the bar graph, the number of students who chose soccer is .
2. Use the pie chart angle to find the total number of students
From the pie chart, soccer is represented by a right angle (), which is of the total.
Let the total number of students be .
AI analysis — may contain mistakes.
Worked this one out on paper? Snap your steps and Gigle's AI math checker will circle the step where it went wrong.
More questions on this topic
- 1一根绳子长米,也就是米. ___ 判断对错
- 2Hamid borrowed a sum of money for 3 years at an interest rate of 3.5% per annum simple interest to pay for his car. If t…
- 3| Carton | Number of toys | Percentage of toys which are defective | | :--- | :---: | :---: | | A | 200 | 3% | | B | 300…
- 4某商场进行促销活动,对一些商品打折出售,妈妈在商场花了 240 元买了一件衣服,比原价便宜了 60 元。这件衣服是打( )折出售的。 A. 二五 B. 四 C. 五 D. 八
- 5: